Free Slope Calculator: Find the Grade Between Two Points
What a Free Slope Calculator Tells You
A slope calculator answers one practical question: how steep is the ground here? Between two points, or along a whole path, this tool works out the horizontal distance, the change in elevation, and turns those two numbers into a percent grade calculator reading, an angle in degrees, and a ratio like 1 in 12. Road signs, building codes, surveyors and hikers each tend to use a different one of those three, so seeing all three together, for the same real ground, saves a conversion most people get wrong under pressure. Think of it as a slope analysis generator: draw the path once, and it writes the verdict, the segment table and the chart for you.
Percent, Degrees, or a Ratio: Three Ways to Say the Same Slope
A 10 percent grade, an angle of 5.71 degrees, and a ratio of 1 in 10 all describe exactly the same slope. As a slope percentage calculator and a grade to degrees calculator, this tool takes the arctangent of the rise divided by the run to get the angle, and as a gradient ratio calculator it also works out the 1-in-x figure that building codes and accessibility rules tend to quote. You never have to pick one; every result shows all three.
Draw a Path, Don't Guess
Type an address to use it as a slope calculator by address, or click straight on the map. Click just two points for a quick gradient calculator between two points reading, or click along an entire driveway, trail or street for a road slope calculator that reports every segment on its own, not just one number averaged across the whole thing. A path can be edited afterwards: drag any point to fix it, or double-click a point to remove it. Because it is a free slope calculator on map online, you can try it as many times as you like, on any device, without an account.
Where the Elevation Comes From
The ground height at each point comes from a free public elevation service built on SRTM satellite data, on a grid of about 90 metres. That makes this an elevation grade calculator best suited to a path of a few hundred metres or more: a hillside driveway, a trail, a stretch of road, or the fall across a large plot of land. It draws a slope map free of charge from that same data, so you can see the shape of the ground as well as the numbers. It is not built for a short, exact measurement, a single ramp, a doorstep, a few metres of drain pipe, where the 90 metre grid cannot tell two nearby points apart; the accuracy section further down this page explains why, and a tape measure or a spirit level will always beat this tool at that scale.
Who Uses a Slope and Gradient Calculator
Hikers and cyclists sizing up a climb of a few hundred metres to several kilometres before they commit to it, road and civil engineers doing an early, rough check of a route before a full survey, and landscapers or farmers looking at the drainage and the fall across a large plot, a field or a whole site. Homeowners with a long rural driveway or a hillside access road can check it here too, and builders can use it as a first, rough wheelchair ramp slope calculator or ADA ramp slope calculator for the wider approach path around a ramp, not the ramp itself, which is normally far too short for this tool's data to measure; the section below on wheelchair ramps explains why. If the ground you want to measure runs for at least a couple of hundred metres, you can likely measure it here.
Key Features of This Free Gradient Calculator
- A free slope calculator that runs in any browser, with no account and no limit on how many paths you measure.
- Slope calculator by address: search an address or use your current location, then draw on a satellite map.
- Works as a two-point gradient calculator or a many-point path, with drag-to-edit and undo.
- Every result in percent, degrees and a 1-in-x ratio, for the path as a whole and for every individual segment.
- Total climb, total descent, average grade and the single steepest segment, called out separately.
- An elevation profile chart coloured by steepness, and a grade-by-segment bar chart.
- A five-band steepness scale (flat, gentle, moderate, steep, very steep), plus real reference figures for ramps, driveways, roads, rail and hiking.
- A percent, degree and ratio conversion table for a quick manual look-up.
- A free PDF report with a maplity.com letterhead and watermark.
- A single path can be up to 10 kilometres long, sampled every 100 metres, to keep the free elevation lookup fast for everyone; measure a longer route as a few shorter paths.
- Works as a slope map generator online, turning any drawn path into a coloured elevation profile chart and a grade chart automatically.
How to Use the Slope and Gradient Calculator: Step by Step
Type your address in the search box and press Search, or press My Location. Zoom in until you can clearly see the ground you want to measure. The map starts in satellite view, the easiest way to line up a driveway, a trail or a street.
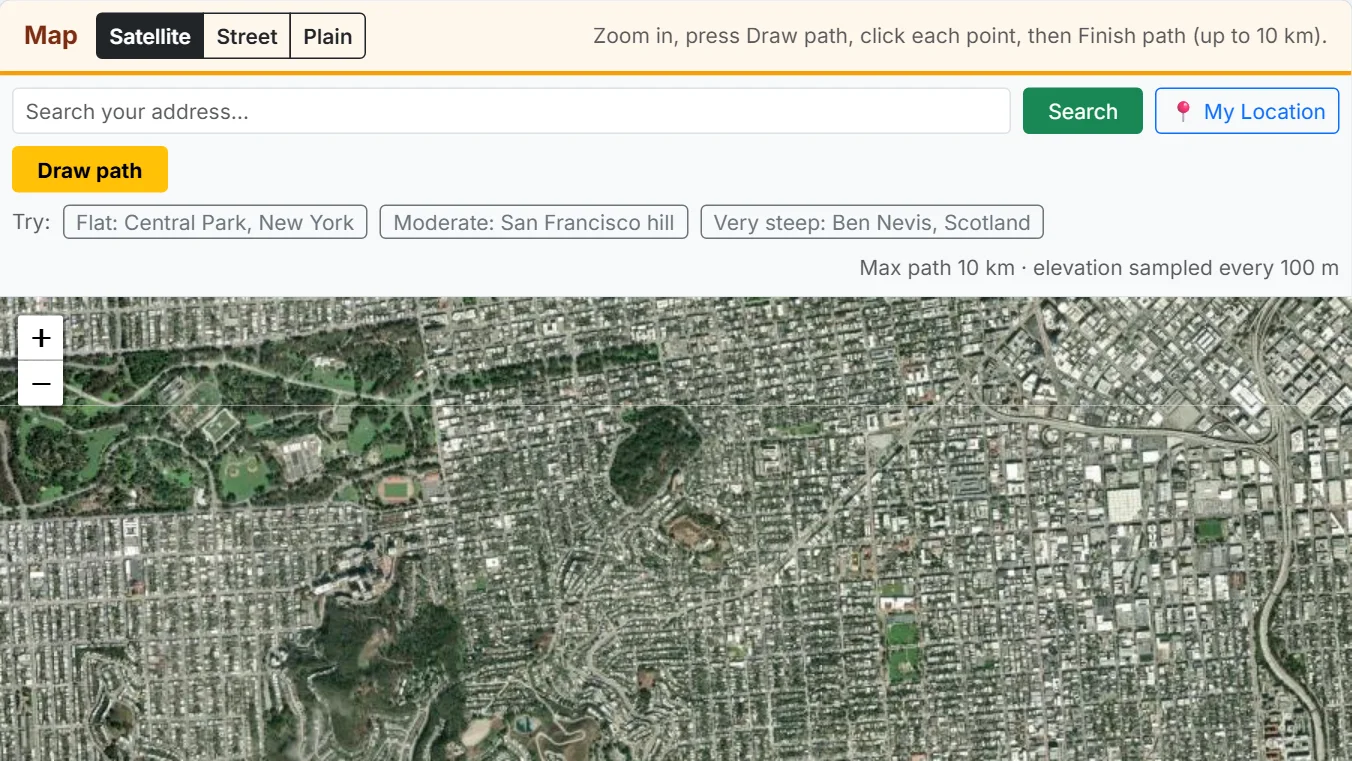
Press Draw path and click along the route. Two clicks give a straight-line measurement between two points; more clicks follow a winding road or trail more closely. Double-click, or press Finish path, to end. A single path can be up to 10 kilometres long.
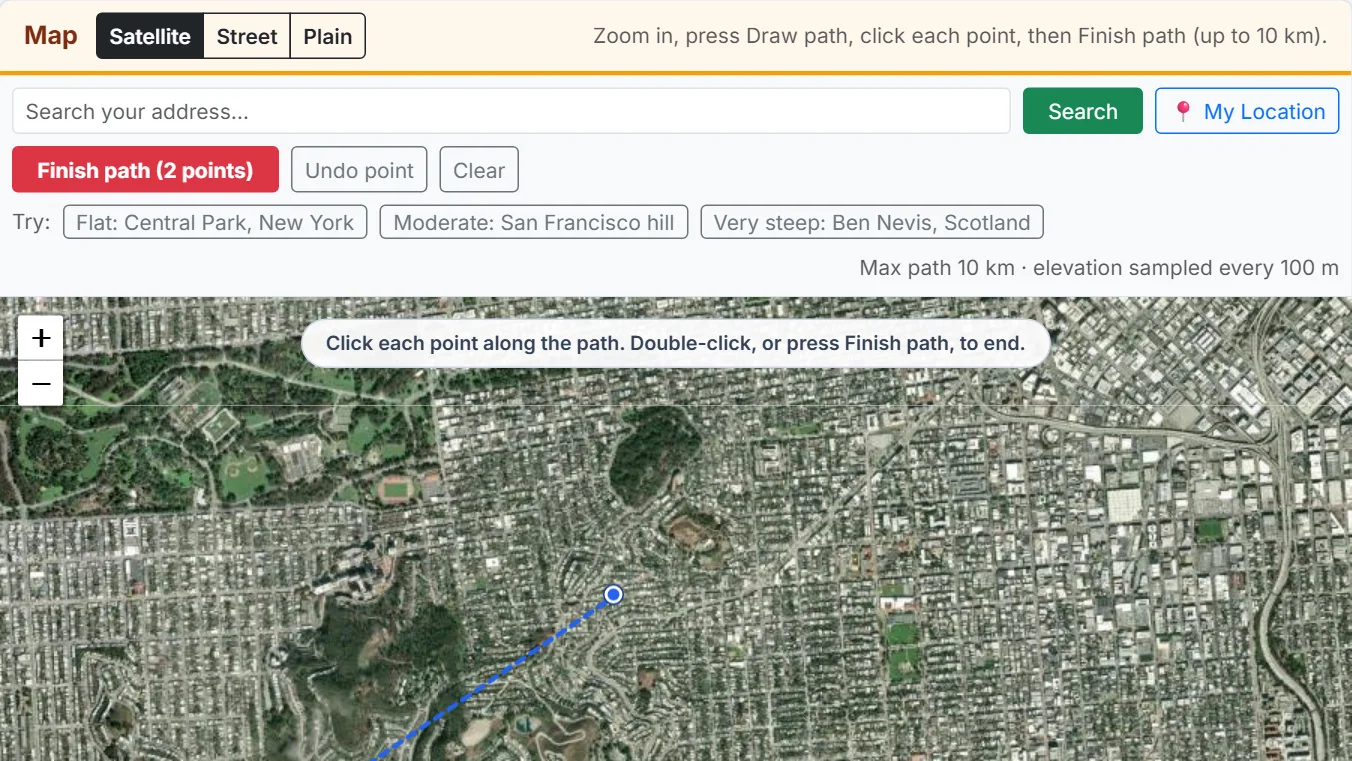
Drag any point to move it, or double-click a point to remove it (a path always needs at least two). Press Reverse direction to look at the same path from the other end, or Clear and start again. The elevation chart updates automatically, sampling the ground every 100 metres along the way.

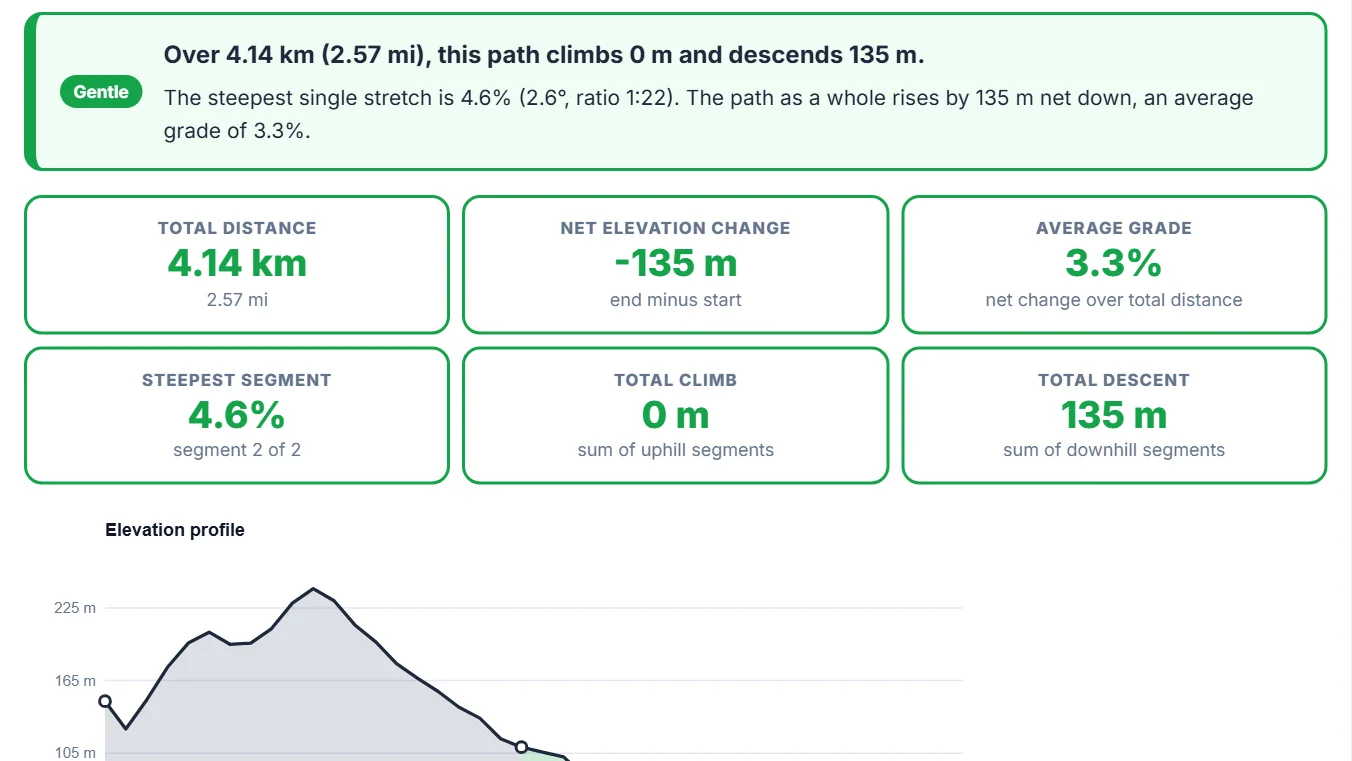
The result shows the total distance, the net climb and descent, the average grade for the whole path, and the steepest single segment, each with its percent, degree and 1-in-x figures.
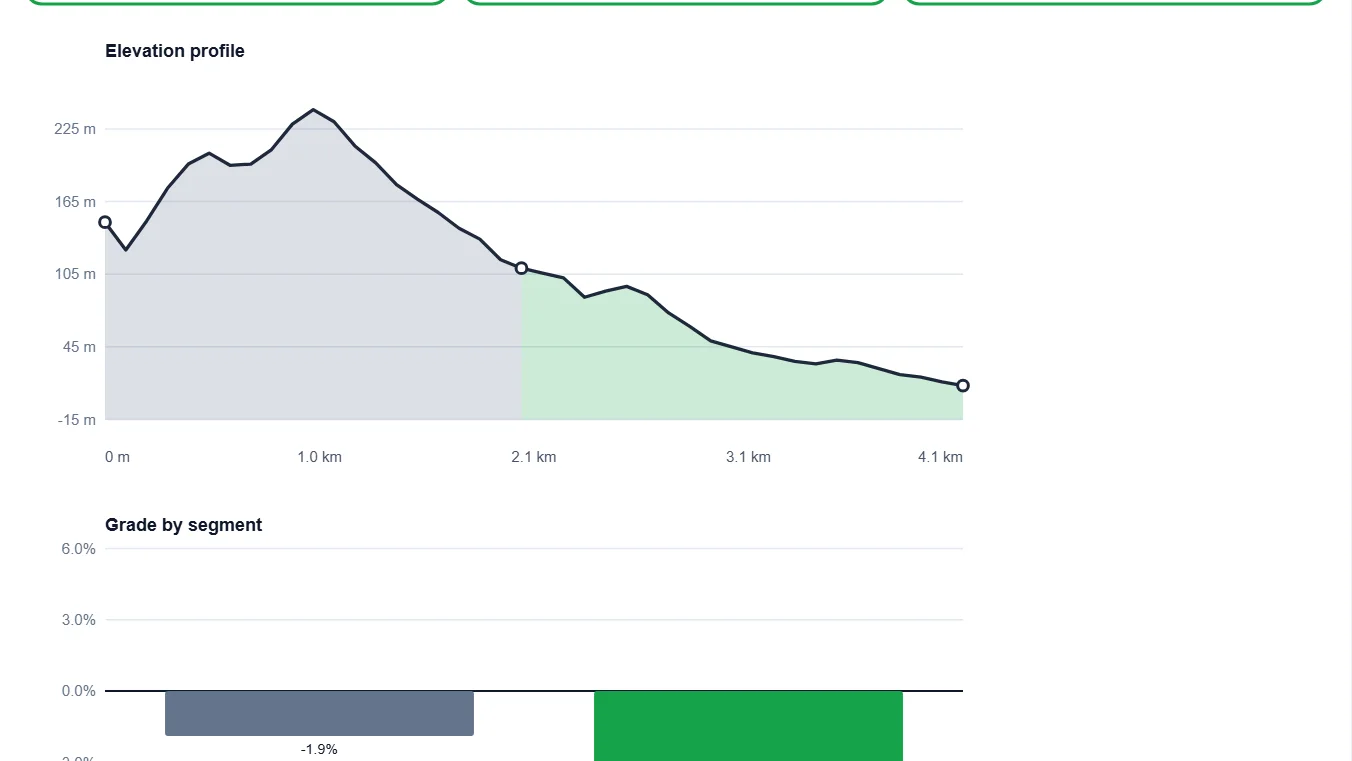
The elevation profile is coloured by how steep each stretch is. The grade-by-segment chart shows uphill and downhill at a glance. The table below gives the exact distance, elevation change, grade, angle and ratio for every segment you drew.
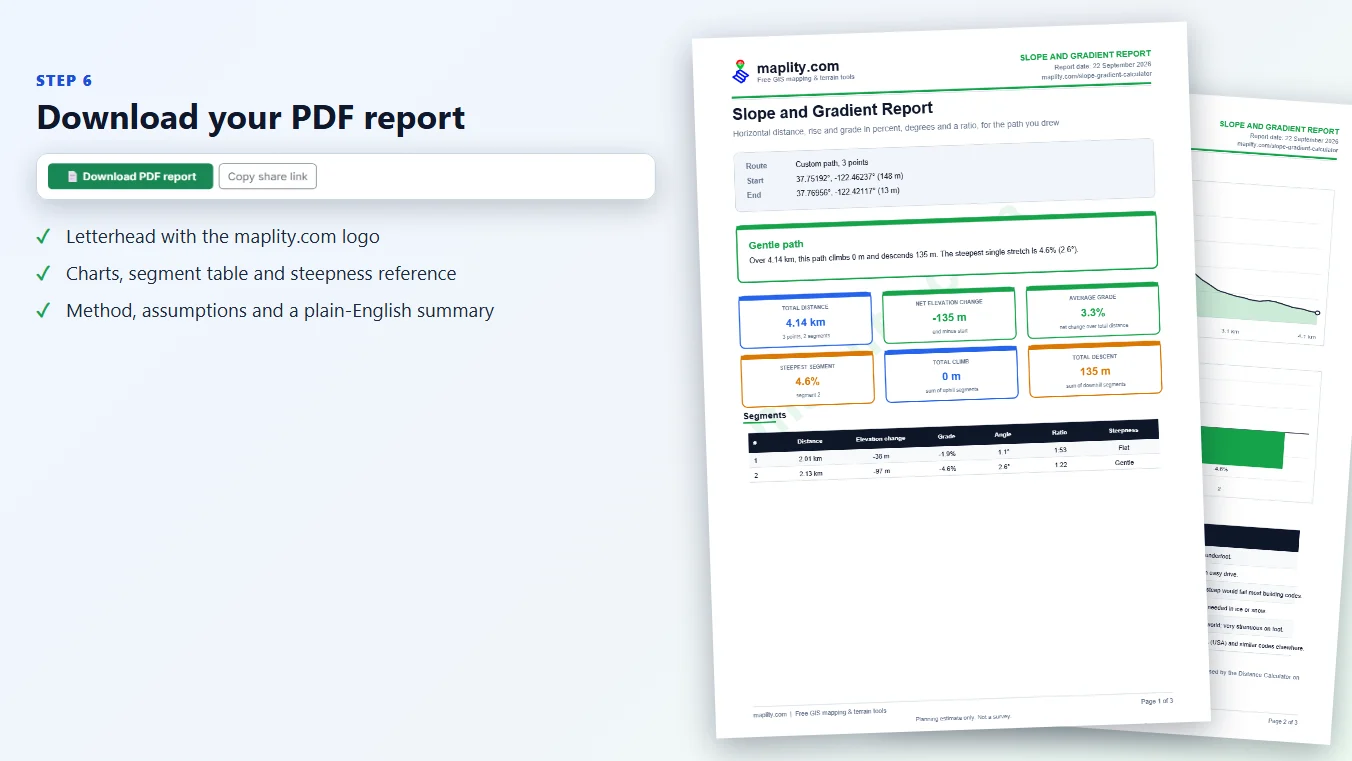
Press Download PDF report to save a report with a maplity.com letterhead and watermark: the summary, the key figures, the segment table, both charts, a steepness reference table and the method. Share it or keep it for your records.
How the Slope and Gradient Calculator Works
From Two Clicks to a Distance: the Haversine Formula
Every point you click is a latitude and longitude. The tool finds the great-circle (haversine) distance between two consecutive points, the same formula used by the Distance Calculator on this site, which is accurate to well under a metre for the short and medium distances a slope measurement normally covers.
The Three Formulas: Percent, Degrees, Ratio
For a segment with a horizontal run and a rise (the change in elevation, positive uphill and negative downhill):
- Grade (percent) = (rise / run) x 100
- Angle (degrees) = arctan(rise / run) x (180 / pi)
- Ratio = run / rise, written as "1 in" that number
A Worked Example
Take a path that runs 200 metres horizontally and climbs 20 metres. The grade is 20 divided by 200, times 100, a 10 percent grade. The angle is the arctangent of 0.10, about 5.71 degrees. The ratio is 200 divided by 20, a 1-in-10 slope. All three describe the same stretch of ground; this calculator works out all three for every segment of the path you draw, using a real elevation reading rather than a made-up number.
Two Points or a Full Path: Why More Points Give a Truer Answer
A two-point reading is a straight line "as the crow flies". The straight-line distance from the Glen Nevis valley to the summit of Ben Nevis, Scotland's highest mountain, is only about 4.4 km, and the real elevation gain of 1,293 m over that short, straight distance gives a very steep average of 29.1 percent (16.2 degrees, a ratio of 1:3). The real path up the mountain is commonly cited at around 8.5 km one way with its switchbacks, and the same climb over that longer, truer distance averages a gentler (if still strenuous) 15.2 percent. Clicking points along the real route, rather than just its two ends, is what turns a theoretical straight-line number into a realistic one.
Why the Chart Samples the Ground Every 100 Metres
The segment table always uses the exact points you clicked. The elevation chart does a little more: it also samples the ground every 100 metres along a straight line between each pair of points, so a long, gently curving stretch of real ground shows its true shape on the chart instead of a flat straight line between two clicks that happen to be far apart. This spacing is fixed rather than a setting, so a full-length, 10 kilometre path never asks the free elevation service for more than about a hundred points in one go.
Why a Path Is Limited to 10 Kilometres
A single path on this tool can be up to 10 kilometres long. That limit, together with the fixed 100 metre sampling above, keeps every request to the free public elevation service small and fast, and keeps that same free service available for everyone else using this tool at the same time. A drive, a hike or a route longer than 10 kilometres can still be measured: break it into a few shorter paths end to end, or draw and check the steepest stretches one at a time.
Steepest Segment vs. Average Grade: Why Both Matter
A path's average grade, the net elevation change divided by the total distance, can hide a short, sharp climb in the middle of an otherwise gentle route. This tool always reports both: the average for the path as a whole, and the single steepest segment on its own, because a driveway, an access road or a bike route that is fine on average can still be unmanageable on its worst stretch.
Percent, Degrees and Ratio: A Slope Conversion Table
How to Read This Table
Find your grade in whichever column you already have it in, then read across for the same slope in the other two formats. This is the exact arctangent relationship the tool itself uses, not the rough shortcut (grade percent is close to degrees times about 1.75) that only holds up to roughly 15 percent.
Percent Grade, Degrees and Ratio, Side by Side
| Grade (%) | Angle (degrees) | Ratio | Note |
|---|---|---|---|
| 1% | 0.57° | 1:100 | nearly flat |
| 2% | 1.15° | 1:50 | |
| 3% | 1.72° | 1:33 | |
| 4% | 2.29° | 1:25 | |
| 5% | 2.86° | 1:20 | |
| 6% | 3.43° | 1:17 | |
| 8% | 4.57° | 1:13 | |
| 8.33% | 4.76° | 1:12 | 1 in 12, the ADA ramp maximum |
| 10% | 5.71° | 1:10 | |
| 12% | 6.84° | 1:8.3 | |
| 15% | 8.53° | 1:6.7 | |
| 20% | 11.3° | 1:5.0 | |
| 25% | 14.0° | 1:4.0 | |
| 33.30% | 18.4° | 1:3.0 | 1 in 3 |
| 45% | 24.2° | 1:2.2 | |
| 50% | 26.6° | 1:2.0 | |
| 75% | 36.9° | 1:1.3 | |
| 100% | 45.0° | 1:1.0 | 1 in 1, a 45 degree angle |
A Quick Mental Shortcut, and Where It Breaks Down
For grades under about 15 percent, the angle in degrees is roughly the grade percent multiplied by 0.57 (or, the other way round, percent is roughly degrees times 1.75). A 10 percent grade is close enough to 5.7 degrees either way. Past about 30 percent the two scales pull apart fast, which is why a very steep slope quoted in degrees always sounds far gentler than the same slope quoted as a percentage; a 45 degree angle, for instance, is a 100 percent grade, not 45 percent.
Steepness in Context: What a Grade Actually Means
This Tool's Own Steepness Scale
The verdict banner in the tool uses this five-band scale, its own working definition rather than any single official standard, to give a quick first read on any path:
| Band | Grade | What it usually feels like |
|---|---|---|
| Flat | Under 2% | Barely noticeable underfoot or by car. |
| Gentle | 2% to 5% | An easy walk or drive; most footpaths and many roads. |
| Moderate | 5% to 10% | A noticeable hill; too steep for most accessible ramps. |
| Steep | 10% to 15% | A steep street or driveway; care needed in ice or heavy rain. |
| Very steep | Over 15% | Among the steepest streets in the world; strenuous on foot. |
Wheelchair Ramps and Accessibility Codes
Used as an ADA ramp slope calculator, this tool gives a quick first read on the walkway or approach around a ramp, not the ramp itself, which is normally only a few metres long and too short for the elevation data behind this tool to measure. In the United States, the ADA sets a maximum running slope of 1 in 12 (about 8.3 percent, 4.8 degrees) for an accessible ramp, with a maximum cross slope of about 2 percent and required flat landings at set intervals. Similar limits exist in building codes elsewhere, though the exact figures, landing spacing and maximum unbroken run vary by country and by code. Treat this tool as a first look at the surrounding site, and measure the ramp itself by hand, or have an installer do it, before you rely on a number for a real project.
Driveways and Private Roads
Used as a driveway slope calculator, this tool works best on a longer driveway, a rural block or a hillside access road of a couple of hundred metres or more, where it answers the question most owners actually have: is this too steep for a normal car? Most residential guides treat up to about 10 to 12 percent as comfortable for a normal car, 12 to 15 percent as manageable but noticeable, and above 15 to 20 percent as steep enough to need extra care, a rougher surface for grip, or a switchback, especially anywhere that sees ice or snow. On a short urban driveway, well under 100 metres, measure by hand instead: a short, very steep section right at a garage entrance, where the underside of a low car can scrape, is exactly the kind of small, local change in grade that 90 metre elevation data will miss.
Public Roads and Mountain Passes
Public roads are rarely built steeper than about 15 to 20 percent even in mountainous terrain, because of vehicle traction, braking distance and winter maintenance, though short stretches on a mountain pass or in a hilly city sometimes exceed that for a block or two. Long mountain roads usually use switchbacks specifically to keep the sustained grade well under what a straight climb up the same hillside would require.
Railways: Much Gentler Than Roads
Conventional railways need far gentler grades than roads, because steel wheels on steel rails have much less grip than rubber tyres on tarmac: most mainline railways are built well under 2 to 3 percent. A handful of specialised rack, or cogwheel, railways are built to climb far steeper than any normal train could manage; Switzerland's Pilatus Railway is widely cited as the steepest cogwheel railway in the world, at a maximum gradient of around 48 percent, roughly the same steepness as this tool's own "very steep" example on Ben Nevis.
Hiking and Trail Difficulty
Hiking guides commonly treat an average trail grade under about 5 percent as easy, 5 to 10 percent as moderate, and sustained grades over 10 to 15 percent as strenuous, especially over a long distance or at altitude. As the Ben Nevis example above shows, the honest way to size up a hike is the average grade over the real, switch-backed trail distance, not the much steeper straight-line figure between the trailhead and the summit.
Cycling Climbs
Cyclists and race organisers usually rate a climb by both its steepness and its length together, not steepness alone: a short, brutally steep ramp and a long, gentle mountain pass can earn a similar difficulty rating. As a rough feel for steepness on its own, a sustained 3 to 5 percent is a noticeable but manageable climb, 5 to 8 percent is hard work for most riders, and sustained sections over 10 percent are considered genuinely difficult even for strong cyclists.
Drainage and Grading
Landscaping and drainage guides commonly recommend a minimum slope of about 1 to 2 percent to keep water moving by gravity alone, and rarely more than about 5 percent on open, planted ground before erosion becomes a real risk. This tool is a better fit for the overall fall across a large yard, a field or a whole site than for a single short drain run: a few metres of pipe next to a downspout is far too short for 90 metre elevation data to read, so check that stretch with a spirit level instead. Too flat and water pools against a wall or a foundation; too steep and rain can wash away soil, mulch or gravel over time.
Roof Pitch: the Same Maths, a Different Convention
Roofers usually state a roof's slope as a rise per 12 inches of run rather than a percent grade, so a "4 in 12" roof is a grade of about 33 percent and an angle of about 18.4 degrees. If you already have a roof or panel angle in degrees, Maplity's Roof Solar Calculator and Solar Panel Tilt Angle Calculator use the same angle convention as this tool, so the three work well together when you are planning solar panels on a sloped surface.
How Accurate Is This Slope Calculator?
What This Tool Gets Right
The horizontal distance between the points you click is exact, to the precision of the map itself. The elevation comes from a real, widely used public data source (SRTM, on a roughly 90 metre grid), so over a path measured in hundreds of metres or kilometres, the grade this tool reports is normally a solid planning figure, within a percent or two of a proper survey.
The 90 Metre Problem
SRTM data records one elevation value for roughly every 90 by 90 metre square of the Earth's surface. A segment shorter than about 50 metres, or a small rise or dip in the middle of a longer stretch, can fall entirely inside one grid square, or straddle two squares in a way that does not reflect the real ground in between. This tool flags any segment under 50 metres with a warning for exactly this reason.
Straight-Line vs. Real Path
A two-point reading always understates the true length, and therefore overstates the true average grade, of any route that curves. The Ben Nevis example earlier on this page shows the effect clearly: a straight-line reading of 29.1 percent against a real-trail average closer to 15.2 percent, for the exact same climb. Draw more points along the real route whenever the route curves by more than a small amount.
When to Get a Real Survey Instead
For anything built to a legal tolerance, a wheelchair ramp, a drainage fall, a foundation, or a road, use this tool for an early, free planning estimate only, then confirm the real figure with a laser level, a dumpy level, or a licensed surveyor before construction. The gap between a 90 metre satellite grid and a real, on-site measurement is exactly the kind of difference that matters for anything with a legal or safety tolerance attached to it.
What to Do With Your Result
Building a Ramp or Driveway
Compare your result against the specific building code or accessibility standard that applies where you live, not just this page's general figures. For a ramp itself, always get a direct site measurement: a laser level or a spirit level beats any satellite-based tool at that scale. For a longer driveway or access road, get a site measurement wherever the grade is close to a legal limit before you commit to a design.
Planning a Hike or a Ride
Draw the real route, not just its start and end, and compare the average grade with the hiking or cycling guidance above. Check the steepest segment too: a short, sharp section can matter more for how hard a route feels than its average grade suggests.
Drainage and Landscaping Checks
Draw a line along the direction water should flow, away from a building, and check it sits within the 1 to 2 percent range most drainage guides recommend as a minimum, without running so steep that it risks erosion on bare or planted ground.
Getting a Second Opinion
For a figure that will be signed off, checked by an inspector, or built to a legal tolerance, treat this tool as the first pass. A large-scale topographic map, a surveyor, or a laser level will always beat 90 metre satellite data for a final number.
10 Most Asked Questions About Slope and Gradient
What is a good slope or gradient for a driveway?
How do I convert a percent grade to degrees?
What is the maximum slope for a wheelchair ramp?
How accurate is a free slope calculator that uses satellite elevation data?
What is the difference between percent grade, degrees, and a ratio like 1:12?
Why does the tool show a different grade if I draw more points along the route?
What is considered a steep road or street?
How do I calculate slope from two elevations and a distance by hand?
What is a good slope for drainage or a French drain?
How does a roof pitch, like "4 in 12", compare to a percent grade?
Method, Sources and Credits
Method and Data Sources
- Horizontal distance: the haversine great-circle formula, the same one used by the Distance Calculator on this site.
- Elevation: SRTM data (Shuttle Radar Topography Mission) at roughly 90 metre resolution, served by a free public elevation API.
- Grade, angle and ratio: standard trigonometry (rise over run, its arctangent, and its reciprocal), applied to every segment of the path you draw.
- Map: Leaflet. Place search: Nominatim and OpenStreetMap contributors.
- Satellite images and street maps: Esri, CARTO and OpenStreetMap. PDF files are created in your browser with jsPDF, and your path is not stored.