What Is This Flood Risk Map?
What the Flood Risk Map Does
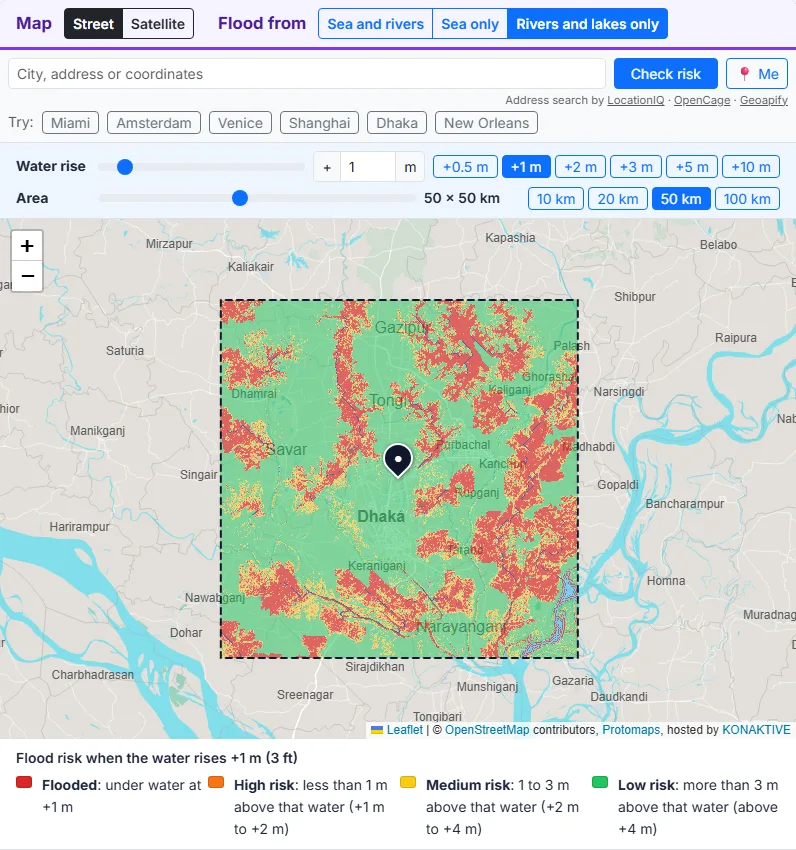
You choose a point and the size of a square around it. The tool loads the height of the ground in that square from free terrain data, finds the sea and the streams, rivers and lakes, and works out for every point how much the water must rise to reach it. Then it colours all the land in the square for the water rise you set: red where it floods, and orange, yellow and green the higher it lies above that water. Nothing is calculated in advance; every map is made for the point you choose.
The Four Colours: Red, Orange, Yellow and Green
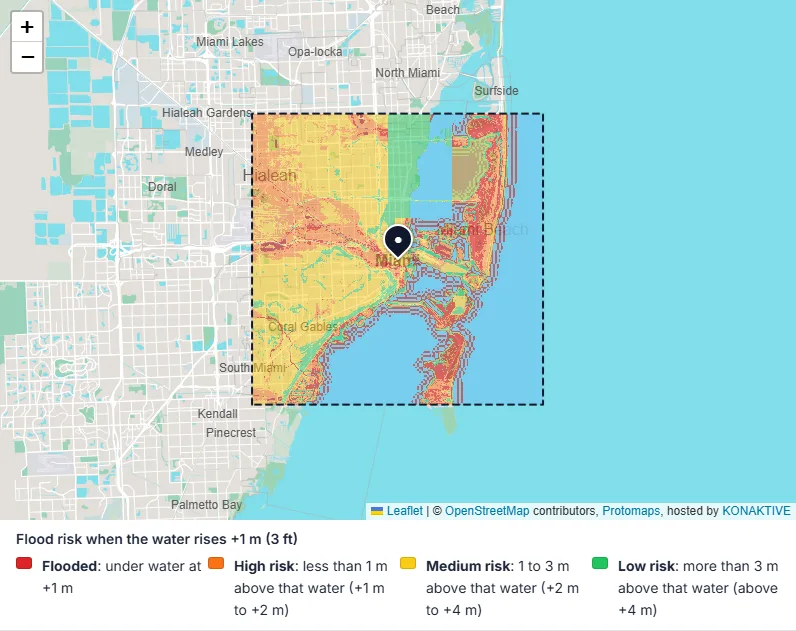
The colours depend on the water rise you set. The table gives them for the +1 m the map opens with; at +2 m every limit moves up by 1 m.
| Colour | Meaning at +1 m | What it tells you |
|---|---|---|
| Flooded | under water at +1 m | This land is under water when the sea, the rivers and the lakes rise by 1 m |
| High risk | less than 1 m above that water (+1 m to +2 m) | One more metre of water reaches it: at risk in a bigger flood or a storm surge |
| Medium risk | 1 to 3 m above that water (+2 m to +4 m) | Only a large flood or a strong storm surge reaches it |
| Low risk | more than 3 m above that water (above +4 m) | Unlikely to flood from the sea or a river (heavy rain can still cause local flooding) |
Free, Private and Without Sign-Up
There is no account and no payment. The terrain data loads straight from AWS into your browser, and the risk is computed on your own device. A share link holds only the point, the area size and the source.
How to Check the Flood Risk of a Place
Choose a Place
Click anywhere on the map, press Me to use your location, or type a city, an address or coordinates such as 25.7617, -80.1918 and press Check risk. The Try buttons open Miami, Amsterdam, Venice, Shanghai, Dhaka and New Orleans. Click somewhere else at any time to check a new place.
Set the Water Rise
The map opens at a water rise of +1 m. Move the Water rise slider from 0 to 10 m, type a value, or press +0.5, +1, +2, +3, +5 or +10 m. The colours change at once, without loading the data again.
Set the Size of the Area
The Area slider sets the square from 10 x 10 km to 100 x 100 km in steps of 5 km; the buttons jump to 10, 20, 50 or 100 km. A 10 km square shows a neighbourhood in fine detail; a 100 km square shows a whole coast or river valley.
Sea, Rivers and Lakes
Sea and rivers (the default) shows the higher of the two risks for every point. Sea only shows the risk from sea level rise and storm surge. Rivers and lakes only shows the risk from rivers, streams and lakes, which matters most inland.
The Check Takes About 10 Seconds
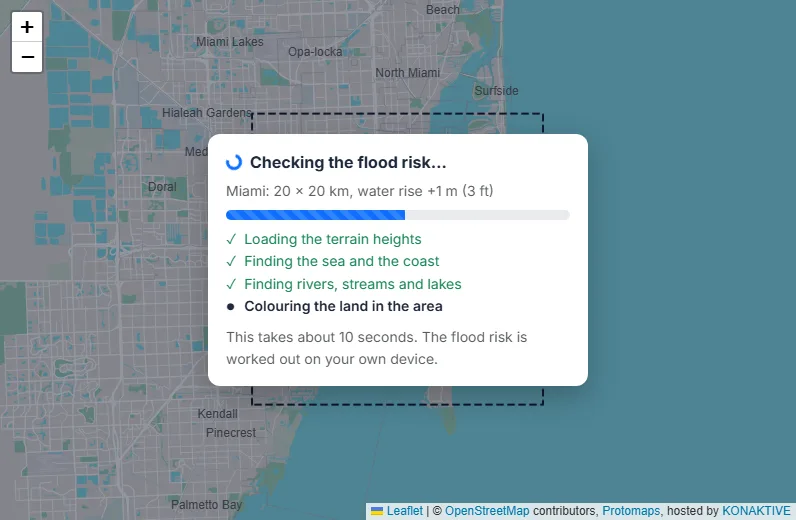
After you choose a place or an area size, a window over the map shows the check running: the terrain heights load, the sea and the coast are found, the rivers, streams and lakes are traced, and the land is coloured. The results appear after about 10 seconds. Changing the water rise or the source afterwards is instant.
Reading the Results
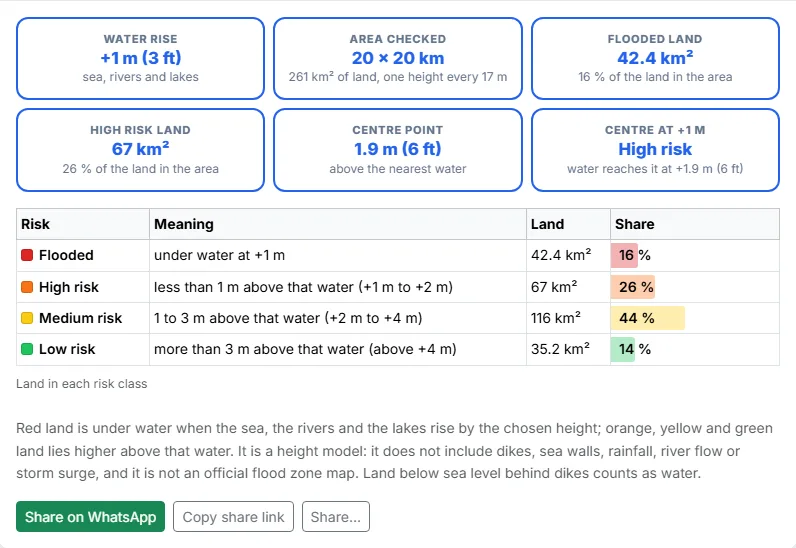
Under the legend, the cards show the water rise, the size of the area with its land and map detail, the flooded (red) land, the high risk (orange) land, the height of the centre point above the nearest water and its colour at the chosen rise. The table lists the land in every colour class in km² and percent.
How to Use the Flood Risk Map: Step by Step
Click anywhere on the map, press Me to use your location, or type a city, an address or coordinates and press Check risk. The Try buttons open six well-known places.
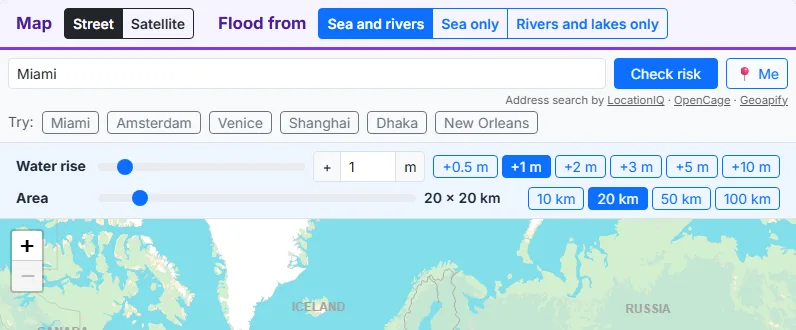
The water rise starts at +1 m. Move its slider from 0 to 10 m, type a value or press a button such as +2 m or +5 m. Move the Area slider from 10 x 10 km to 100 x 100 km, or press 10, 20, 50 or 100 km.
A window over the map shows the check running: loading the terrain heights, finding the sea and the coast, finding the rivers, streams and lakes, and colouring the land. The results appear after about 10 seconds.
All the land inside the square is coloured. Red is under water at the chosen rise. Orange lies less than 1 m above that water, yellow 1 to 3 m above it, and green more than 3 m above it. Change the water rise and the colours change at once.
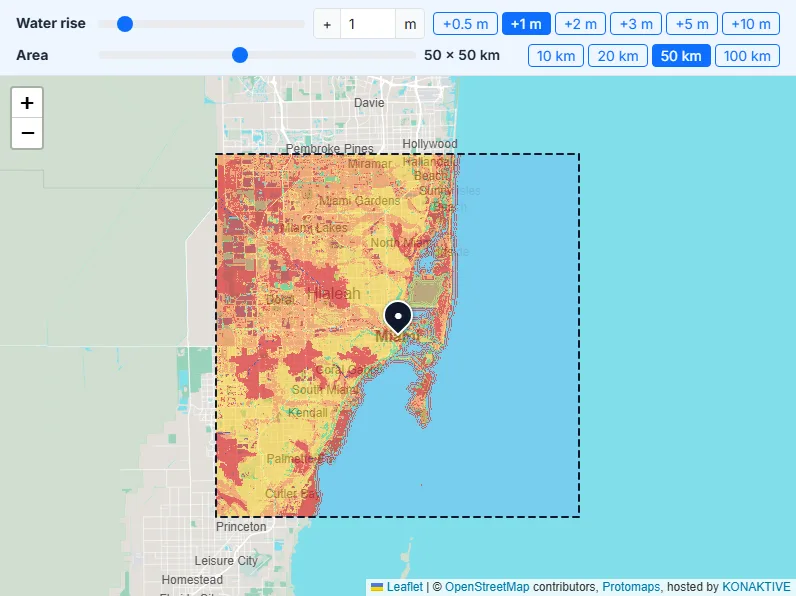
Sea and rivers counts both. Sea only shows the risk from sea level rise and storm surge. Rivers and lakes only shows the land just above the streams, rivers and lakes, which the tool finds from the terrain.
The cards show the water rise, the area, the flooded land, the high risk land and the risk at the centre point, and the table lists the land in every colour class. Share on WhatsApp or copy a link that opens the same check.
How the Flood Risk Is Worked Out
1. The Terrain Data
The heights come from the AWS Terrain Tiles, a free elevation dataset for the whole world. It joins the best open data for each place: detailed USGS 3DEP surveys in the USA, national lidar surveys in some countries (such as the UK, Austria and New Zealand), SRTM satellite data in most other countries, GMTED for the coarse zoom levels, and ETOPO1 for the sea floor.
2. Risk From the Sea
Every point at or below 0 m is the sea. From the sea, the tool spreads outwards over the land and notes, for every point, the lowest water level that can reach it: the highest point on its lowest path to the sea. So a low field behind a ridge stays dry until the water is higher than the ridge.
3. Risk From Rivers, Streams and Lakes (HAND)
The tool works out where water flows on the terrain: it routes every point downhill to the sea or the edge of the data (with a “priority flood”, which also crosses flat ground and pits), counts the area that drains through each point, and marks the channels that drain at least 25 km² as rivers and streams: smaller flow paths are often dry valleys or field drains with no water in them. Each point then gets its height above the nearest drainage (HAND), the height above the stream its water reaches first. Land more than 5 km from that stream, along the way its water flows, gets no river risk. The same method is used in the US National Water Model for flood mapping.
4. Area, Detail and Speed
The tool loads the square plus a margin of 12 % on every side, so the sea and the streams just outside the square still count. It picks a detail that gives the square about 1,400 heights per side (up to about 5 m per height in a small square) and first shows a quick map at half that detail.
Sea Level Rise and Floods: the Numbers Behind the Classes
How Much Will the Sea Rise?
The sea has risen about 20 cm since 1900, and it now rises about 4 mm a year. The IPCC (AR6, 2021) expects about 0.3 to 0.6 m more by 2100 if emissions fall fast, and about 0.6 to 1.0 m if they stay very high. Up to about 2 m by 2100 cannot be ruled out. Set the water rise to these values to see the land they reach.
Storm Surge, Tides and Sinking Land
On a given day the sea can be much higher than its average: high tide adds up to several metres in some bays, and a storm surge from a hurricane or typhoon can add 3 to 6 m or more for a few hours; set the water rise to +3 to +5 m to see it. Some cities, such as Jakarta, Bangkok and Venice, are also sinking because of groundwater pumping and soft ground.
River Floods
In an ordinary flood a river rises 1 to 2 m above its normal level; in a big flood it can rise several metres, and in narrow valleys much more. In the Rivers and lakes view, the red and orange land along the streams is the land that gets wet first.
What the Flood Risk Map Cannot Show
Dikes, Sea Walls and Levees
The terrain data does not show most flood defences. Land below sea level behind dikes, such as much of the Netherlands and parts of New Orleans, counts as water. Land behind a levee or a sea wall can look like high risk even where the defence keeps it dry.
Accuracy of the Heights
In the USA the heights are good to about a metre or better. Elsewhere, SRTM data can be off by a few metres and often measures the top of trees and buildings, so a forest or a city centre can look higher, and safer, than the ground really is.
Rain and Flash Floods
Heavy rain can flood streets and basements anywhere, also on high ground, when drains cannot take the water. The tool does not include rainfall, so a green area can still have local flooding in a storm.
Not an Official Flood Zone Map
Official flood maps use river flows, rainfall, tides, waves and flood defences. This tool only uses heights. For insurance, building permits or buying a home, check the official flood maps of your country.
8 Ways to Use a Flood Risk Map
People check flood risk to plan, to learn and to understand where they live. These are eight common uses.
1. Buying or renting a home
Check the flood risk around a house before you buy or rent. A home in a green area has a very different flood risk from one in a red or orange area next to a river or a bay.
2. School projects and climate lessons
Show students which parts of their own town turn red with a 1 m sea level rise, and talk about deltas, dikes and storm surges.
3. Journalists and bloggers
Make a quick flood risk picture of a city or a river valley for a story, with the land in each colour class in km² and percent.
4. Planning and local projects
Get a first look at which roads, fields and buildings sit low near the coast or a river, before a detailed study with official data.
5. Travel and holiday homes
See how low a beach town, an island or a river village lies before you plan a long stay or buy a holiday home.
6. Farms and gardens near rivers
The Rivers and lakes view shows the fields that lie only a metre or two above a stream, which are the first to get wet in a high flood.
7. Flood awareness
Find out how much the water must rise to reach your home, and where the higher, green ground is nearby.
8. Comparing places
Check two towns, two streets or two plots with the same area size and compare their share of red and orange land at the same water rise.
Flood Risk in the UK
Which Parts of the UK Are Most at Risk?
The Environment Agency estimates that about 6.3 million properties in England are in areas at risk of flooding from rivers, the sea or surface water. The lowest land is along the estuaries and in the old marshes: much of Kingston upon Hull lies below the level of high tide, London is protected by the Thames Barrier, and the Fens of East Anglia, the Somerset Levels and the coasts of Lincolnshire and Lancashire lie close to sea level. River flooding also hits inland towns along the Severn, the Ouse, the Trent and the Thames.
Check the Flood Risk of a UK Postcode or Address
Type a UK postcode, such as HU1 1AA, or a full address in the box and press Check risk. Start with a 10 x 10 km area for a street and a 50 x 50 km area for a whole town and its rivers. The Europe table below has links for 38 UK cities.
Official Flood Maps in England, Wales, Scotland and Northern Ireland
Each part of the UK has its own official flood maps. In England, the Environment Agency runs the GOV.UK service “Check your long term flood risk”. In Wales, Natural Resources Wales publishes the Flood Risk Assessment Wales map. In Scotland, SEPA publishes the flood maps, and in Northern Ireland, DfI Rivers publishes Flood Maps NI. Use them together with this tool for insurance, planning and buying a home.
Check the Flood Risk of 137 Cities
How to Use These Links
Press Check flood risk to open the tool on the centre of a city with a 20 x 20 km square and a water rise of +1 m, for the sea and the rivers. The risk is worked out when you open the link, with the same data and method as for any other point. Change the area size or the source in the tool, or click another part of the city.
Flood Risk of Cities in Europe
| City | Country | Coordinates | Flood risk |
|---|---|---|---|
| Amsterdam | Netherlands | 52.3676, 4.9041 | Check flood risk |
| Rotterdam | Netherlands | 51.9244, 4.4777 | Check flood risk |
| The Hague | Netherlands | 52.0705, 4.3007 | Check flood risk |
| Antwerp | Belgium | 51.2194, 4.4025 | Check flood risk |
| Venice | Italy | 45.4408, 12.3155 | Check flood risk |
| London | United Kingdom | 51.5074, -0.1278 | Check flood risk |
| Birmingham | United Kingdom | 52.4862, -1.8904 | Check flood risk |
| Manchester | United Kingdom | 53.4808, -2.2426 | Check flood risk |
| Liverpool | United Kingdom | 53.4084, -2.9916 | Check flood risk |
| Leeds | United Kingdom | 53.8008, -1.5491 | Check flood risk |
| Sheffield | United Kingdom | 53.3811, -1.4701 | Check flood risk |
| Bradford | United Kingdom | 53.7960, -1.7594 | Check flood risk |
| Bristol | United Kingdom | 51.4545, -2.5879 | Check flood risk |
| Newcastle upon Tyne | United Kingdom | 54.9783, -1.6178 | Check flood risk |
| Sunderland | United Kingdom | 54.9069, -1.3838 | Check flood risk |
| Middlesbrough | United Kingdom | 54.5742, -1.2350 | Check flood risk |
| Nottingham | United Kingdom | 52.9548, -1.1581 | Check flood risk |
| Leicester | United Kingdom | 52.6369, -1.1398 | Check flood risk |
| Coventry | United Kingdom | 52.4068, -1.5197 | Check flood risk |
| Wolverhampton | United Kingdom | 52.5862, -2.1286 | Check flood risk |
| Stoke-on-Trent | United Kingdom | 53.0027, -2.1794 | Check flood risk |
| Kingston upon Hull | United Kingdom | 53.7676, -0.3274 | Check flood risk |
| York | United Kingdom | 53.9600, -1.0873 | Check flood risk |
| Norwich | United Kingdom | 52.6309, 1.2974 | Check flood risk |
| Cambridge | United Kingdom | 52.2053, 0.1218 | Check flood risk |
| Oxford | United Kingdom | 51.7520, -1.2577 | Check flood risk |
| Reading | United Kingdom | 51.4543, -0.9781 | Check flood risk |
| Milton Keynes | United Kingdom | 52.0406, -0.7594 | Check flood risk |
| Southampton | United Kingdom | 50.9097, -1.4044 | Check flood risk |
| Portsmouth | United Kingdom | 50.8198, -1.0880 | Check flood risk |
| Brighton and Hove | United Kingdom | 50.8225, -0.1372 | Check flood risk |
| Plymouth | United Kingdom | 50.3755, -4.1427 | Check flood risk |
| Exeter | United Kingdom | 50.7184, -3.5339 | Check flood risk |
| Cardiff | United Kingdom | 51.4816, -3.1791 | Check flood risk |
| Swansea | United Kingdom | 51.6214, -3.9436 | Check flood risk |
| Newport | United Kingdom | 51.5842, -2.9977 | Check flood risk |
| Glasgow | United Kingdom | 55.8642, -4.2518 | Check flood risk |
| Edinburgh | United Kingdom | 55.9533, -3.1883 | Check flood risk |
| Aberdeen | United Kingdom | 57.1497, -2.0943 | Check flood risk |
| Dundee | United Kingdom | 56.4620, -2.9707 | Check flood risk |
| Inverness | United Kingdom | 57.4778, -4.2247 | Check flood risk |
| Belfast | United Kingdom | 54.5973, -5.9301 | Check flood risk |
| Derry | United Kingdom | 54.9966, -7.3086 | Check flood risk |
| Hamburg | Germany | 53.5511, 9.9937 | Check flood risk |
| Copenhagen | Denmark | 55.6761, 12.5683 | Check flood risk |
| Gdansk | Poland | 54.3520, 18.6466 | Check flood risk |
| St Petersburg | Russia | 59.9311, 30.3609 | Check flood risk |
| Stockholm | Sweden | 59.3293, 18.0686 | Check flood risk |
| Dublin | Ireland | 53.3498, -6.2603 | Check flood risk |
| Lisbon | Portugal | 38.7223, -9.1393 | Check flood risk |
| Barcelona | Spain | 41.3874, 2.1686 | Check flood risk |
| Marseille | France | 43.2965, 5.3698 | Check flood risk |
| Naples | Italy | 40.8518, 14.2681 | Check flood risk |
| Piraeus (Athens) | Greece | 37.9420, 23.6465 | Check flood risk |
| Istanbul | Türkiye | 41.0082, 28.9784 | Check flood risk |
Flood Risk of Cities in North America and the Caribbean
| City | Country | Coordinates | Flood risk |
|---|---|---|---|
| New York | United States | 40.7128, -74.0060 | Check flood risk |
| Miami | United States | 25.7617, -80.1918 | Check flood risk |
| New Orleans | United States | 29.9511, -90.0715 | Check flood risk |
| Galveston (Houston) | United States | 29.3013, -94.7977 | Check flood risk |
| Tampa | United States | 27.9506, -82.4572 | Check flood risk |
| Charleston | United States | 32.7765, -79.9311 | Check flood risk |
| Norfolk | United States | 36.8508, -76.2859 | Check flood risk |
| Washington, D.C. | United States | 38.9072, -77.0369 | Check flood risk |
| Boston | United States | 42.3601, -71.0589 | Check flood risk |
| San Francisco | United States | 37.7749, -122.4194 | Check flood risk |
| Long Beach (Los Angeles) | United States | 33.7701, -118.1937 | Check flood risk |
| Seattle | United States | 47.6062, -122.3321 | Check flood risk |
| Vancouver | Canada | 49.2827, -123.1207 | Check flood risk |
| Honolulu | United States | 21.3069, -157.8583 | Check flood risk |
| Havana | Cuba | 23.1136, -82.3666 | Check flood risk |
Flood Risk of Cities in Latin America
| City | Country | Coordinates | Flood risk |
|---|---|---|---|
| Rio de Janeiro | Brazil | -22.9068, -43.1729 | Check flood risk |
| Buenos Aires | Argentina | -34.6037, -58.3816 | Check flood risk |
| Montevideo | Uruguay | -34.9011, -56.1645 | Check flood risk |
| Lima | Peru | -12.0464, -77.0428 | Check flood risk |
| Guayaquil | Ecuador | -2.1894, -79.8891 | Check flood risk |
| Cartagena | Colombia | 10.3910, -75.4794 | Check flood risk |
| Panama City | Panama | 8.9824, -79.5199 | Check flood risk |
| Salvador | Brazil | -12.9777, -38.5016 | Check flood risk |
| Recife | Brazil | -8.0476, -34.8770 | Check flood risk |
| Belem | Brazil | -1.4558, -48.4902 | Check flood risk |
| Valparaiso | Chile | -33.0472, -71.6127 | Check flood risk |
| Santo Domingo | Dominican Republic | 18.4861, -69.9312 | Check flood risk |
Flood Risk of Cities in East Asia
| City | Country | Coordinates | Flood risk |
|---|---|---|---|
| Shanghai | China | 31.2304, 121.4737 | Check flood risk |
| Tianjin | China | 39.3434, 117.3616 | Check flood risk |
| Ningbo | China | 29.8683, 121.5440 | Check flood risk |
| Guangzhou | China | 23.1291, 113.2644 | Check flood risk |
| Shenzhen | China | 22.5431, 114.0579 | Check flood risk |
| Hong Kong | Hong Kong SAR China | 22.3193, 114.1694 | Check flood risk |
| Macau | Macao SAR China | 22.1987, 113.5439 | Check flood risk |
| Taipei | Taiwan | 25.0330, 121.5654 | Check flood risk |
| Tokyo | Japan | 35.6812, 139.7671 | Check flood risk |
| Osaka | Japan | 34.6937, 135.5023 | Check flood risk |
| Incheon | South Korea | 37.4563, 126.7052 | Check flood risk |
| Busan | South Korea | 35.1796, 129.0756 | Check flood risk |
Flood Risk of Cities in Southeast Asia
| City | Country | Coordinates | Flood risk |
|---|---|---|---|
| Bangkok | Thailand | 13.7563, 100.5018 | Check flood risk |
| Ho Chi Minh City | Vietnam | 10.8231, 106.6297 | Check flood risk |
| Hanoi | Vietnam | 21.0278, 105.8342 | Check flood risk |
| Da Nang | Vietnam | 16.0544, 108.2022 | Check flood risk |
| Jakarta | Indonesia | -6.2088, 106.8456 | Check flood risk |
| Semarang | Indonesia | -6.9667, 110.4167 | Check flood risk |
| Surabaya | Indonesia | -7.2575, 112.7521 | Check flood risk |
| Manila | Philippines | 14.5995, 120.9842 | Check flood risk |
| Singapore | Singapore | 1.3521, 103.8198 | Check flood risk |
| George Town (Penang) | Malaysia | 5.4141, 100.3288 | Check flood risk |
| Yangon | Myanmar (Burma) | 16.8409, 96.1735 | Check flood risk |
Flood Risk of Cities in South Asia and the Middle East
| City | Country | Coordinates | Flood risk |
|---|---|---|---|
| Mumbai | India | 19.0760, 72.8777 | Check flood risk |
| Kolkata | India | 22.5726, 88.3639 | Check flood risk |
| Chennai | India | 13.0827, 80.2707 | Check flood risk |
| Kochi | India | 9.9312, 76.2673 | Check flood risk |
| Dhaka | Bangladesh | 23.8103, 90.4125 | Check flood risk |
| Chittagong | Bangladesh | 22.3569, 91.7832 | Check flood risk |
| Karachi | Pakistan | 24.8607, 67.0011 | Check flood risk |
| Colombo | Sri Lanka | 6.9271, 79.8612 | Check flood risk |
| Male | Maldives | 4.1755, 73.5093 | Check flood risk |
| Dubai | United Arab Emirates | 25.2048, 55.2708 | Check flood risk |
| Abu Dhabi | United Arab Emirates | 24.4539, 54.3773 | Check flood risk |
| Doha | Qatar | 25.2854, 51.5310 | Check flood risk |
| Basra | Iraq | 30.5085, 47.7804 | Check flood risk |
Flood Risk of Cities in Africa
| City | Country | Coordinates | Flood risk |
|---|---|---|---|
| Lagos | Nigeria | 6.5244, 3.3792 | Check flood risk |
| Abidjan | Côte d’Ivoire | 5.3600, -4.0083 | Check flood risk |
| Dakar | Senegal | 14.7167, -17.4677 | Check flood risk |
| Casablanca | Morocco | 33.5731, -7.5898 | Check flood risk |
| Alexandria | Egypt | 31.2001, 29.9187 | Check flood risk |
| Port Said | Egypt | 31.2653, 32.3019 | Check flood risk |
| Dar es Salaam | Tanzania | -6.7924, 39.2083 | Check flood risk |
| Mombasa | Kenya | -4.0435, 39.6682 | Check flood risk |
| Maputo | Mozambique | -25.9692, 32.5732 | Check flood risk |
| Durban | South Africa | -29.8587, 31.0218 | Check flood risk |
| Cape Town | South Africa | -33.9249, 18.4241 | Check flood risk |
Flood Risk of Cities in Australia, New Zealand and the Pacific
| City | Country | Coordinates | Flood risk |
|---|---|---|---|
| Sydney | Australia | -33.8688, 151.2093 | Check flood risk |
| Melbourne | Australia | -37.8136, 144.9631 | Check flood risk |
| Brisbane | Australia | -27.4698, 153.0251 | Check flood risk |
| Adelaide | Australia | -34.9285, 138.6007 | Check flood risk |
| Perth | Australia | -31.9505, 115.8605 | Check flood risk |
| Auckland | New Zealand | -36.8485, 174.7633 | Check flood risk |
| Wellington | New Zealand | -41.2865, 174.7762 | Check flood risk |
| Suva | Fiji | -18.1416, 178.4419 | Check flood risk |
Data Sources and Libraries Used in This Tool
Terrain Data: AWS Terrain Tiles
Heights come from the AWS Terrain Tiles (Terrarium format) of the Registry of Open Data on AWS, built from USGS 3DEP, SRTM, GMTED, ETOPO1 and national lidar surveys. They load straight from AWS into your browser.
Place Search
Places are found with LocationIQ, OpenCage and Geoapify, with Photon and Nominatim as free fallbacks, all through Maplity’s server.
Maps
The street map is Maplity’s own vector basemap built from OpenStreetMap data, the satellite map is Esri World Imagery, and the map uses Leaflet 1.9. The page runs on Next.js and React.