Free Roof Solar Calculator App: How Many Solar Panels Can I Fit on My Roof?
What a Free Roof Solar Calculator Tells You
A free roof solar calculator answers three questions in a few minutes: how many solar panels on my roof, how big is the solar system in kW, and how much electricity will it make. Many people search for "how many solar panels can I fit on my roof" and "how much roof space for solar panels". This roof solar calculator app gives the answer for your own roof, because it starts from the roof itself. You draw the outline of the building on a satellite map, and the tool lays real panels on it, one by one, keeping a safe distance from the edges. It counts the panels, adds up the kW, and works out the energy for each month. It runs in your browser on phones, tablets and computers, so there is nothing to download.
Solar Panel Roof Space Calculator: Draw the Roof, Do Not Guess
Most online tools ask you to guess the roof area or enter a size by hand. Here the area comes from your drawing, so a long L-shaped roof, a small garage roof and a large warehouse roof are all handled the same way. This makes it a solar panel roof space calculator and a solar roof size calculator in one tool. You choose a flat roof (the default) or a slanted roof, and the tool changes the layout: racks facing the sun or an east-west layout on a flat roof, and panels that follow the slope on a pitched roof. It is also a tilted roof vs flat roof solar panel kWh calculator: change the roof type and read the kWh again.
A Report Like a Solar Engineer Would Write
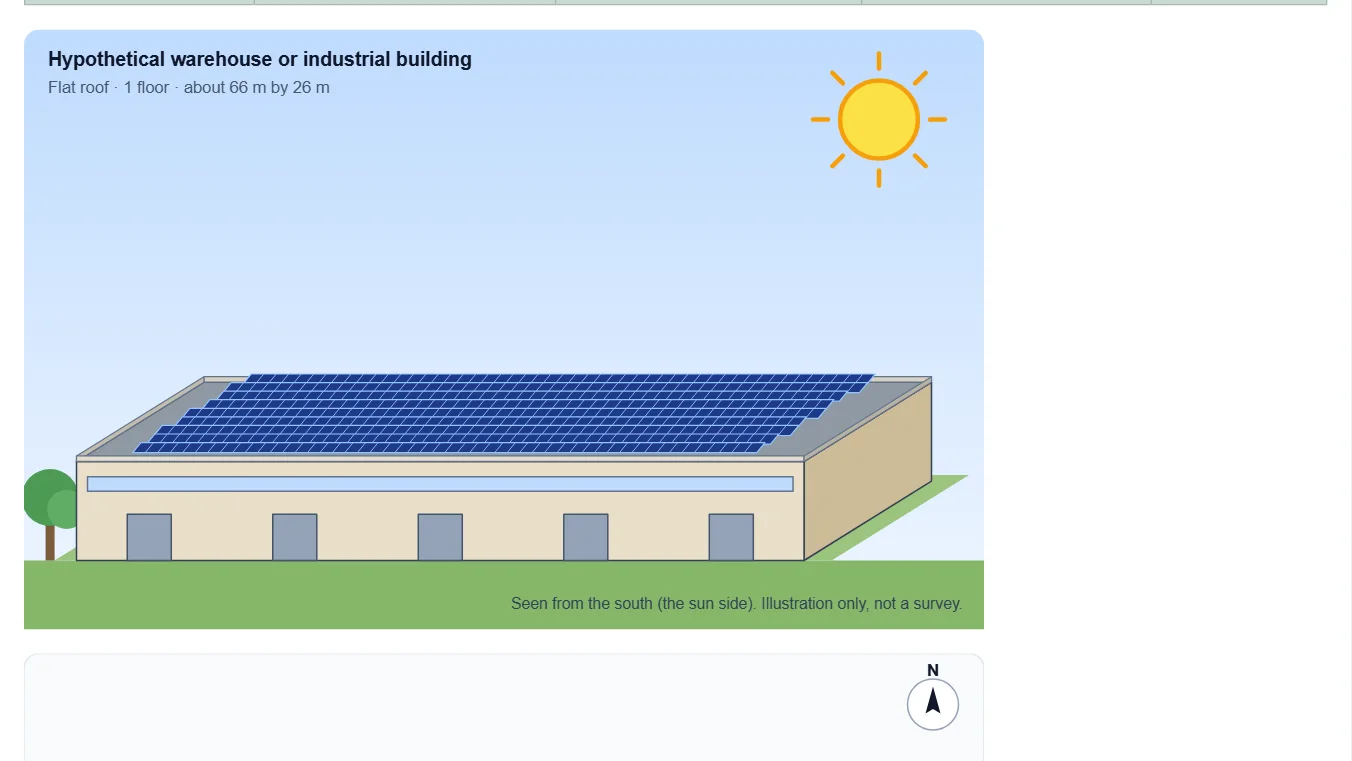
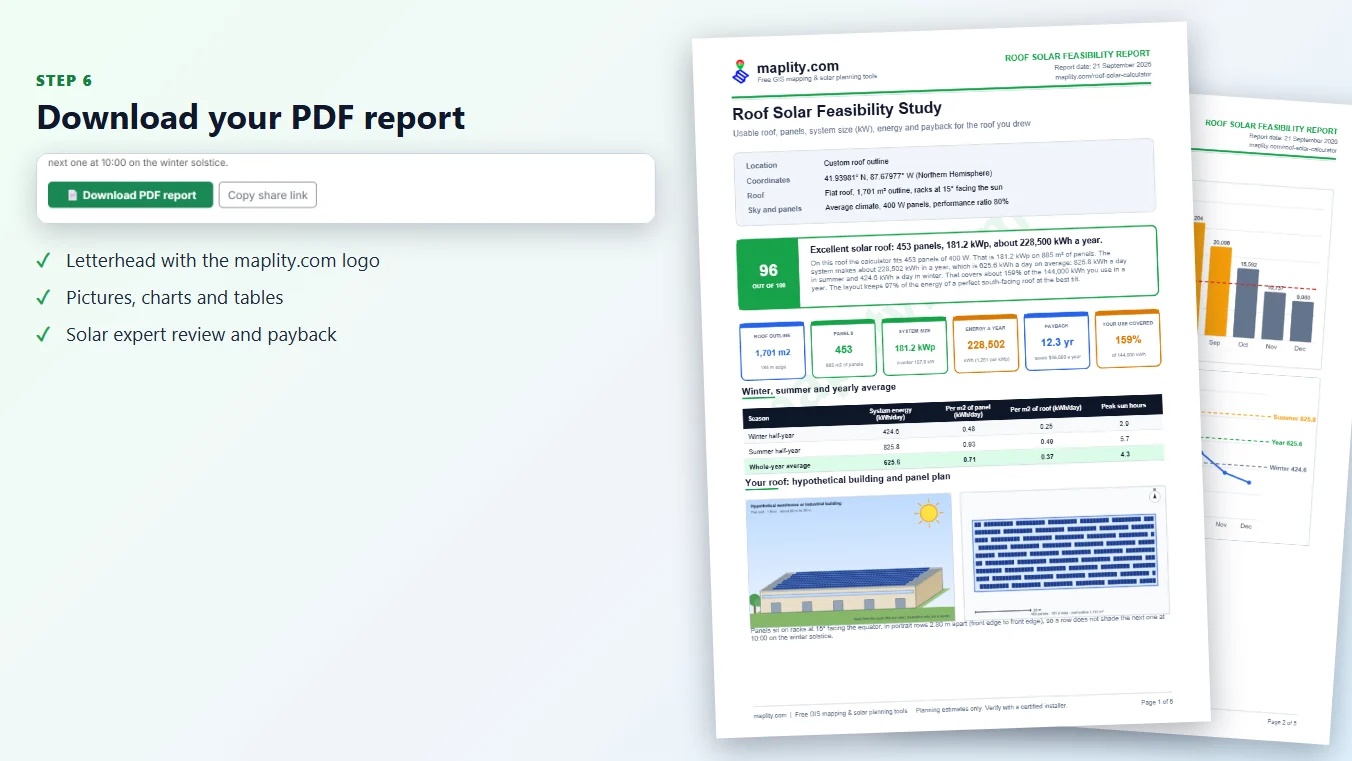
The result reads like a short report from a solar engineer. You get a feasibility score, a hypothetical picture of your house or building with the panels on the roof, charts, a table of winter, summer and yearly average output, the size of the system that matches your electricity use, the cost, the savings and the payback. A written review explains what the numbers mean for your roof. You can download all of it as a PDF report with the maplity.com letterhead. It is a free solar power calculator: no account, no cost and no limit on how many roofs you try.
Solar Calculator by Address, Rooftop Area and Location
There are three ways to think about a solar estimate, and this tool uses all of them. As a solar calculator by address, you type your street address and the map jumps to your building. As a solar energy calculator by rooftop area, it measures the area you draw and turns it into a panel count and a system size, so it also works as a roof area to solar panel capacity calculator. As a solar energy calculator by location, it uses the latitude and the sky conditions of your place to find the sunlight on your roof for every month of the year, so a roof in Phoenix and the same roof in London give different kWh.
Who Can Use This Residential Solar Panel Calculator?
Home owners who want a residential solar panel calculator to know if solar is worth it, installers who need a fast first estimate before a site visit, architects and builders planning a new roof, business owners with a flat warehouse or shop roof, farmers with a barn, and students who learn how solar systems are sized. If you can see the roof on a map, you can use the tool. To check the best angle for your panels in more detail, use the Solar Panel Tilt Angle Calculator. To measure a roof or a field on its own, use the Area Calculator on Map.
Key Features of This Free Solar Power Calculator
- A free roof solar calculator app that runs in any browser. Solar calculator by address: search your address and the map goes to your roof.
- Solar energy calculator by rooftop area: draw the roof corner by corner on a satellite map, drag the corners to adjust, or place a rectangle by width and length.
- Solar energy calculator by location: the sunlight comes from your latitude and your sky conditions, for every month.
- Flat roof by default. Slanted roof with your own slope and ridge direction. East-west or south-facing layouts on flat roofs. Compare a tilted roof and a flat roof in seconds.
- Real panels are placed on the outline, so the panel count is not a guess. It is a solar panel roof space calculator: you see how much roof space for solar panels you have, and the panels on the map.
- Roof area to solar panel capacity: the area becomes a number of panels and a system size in kWp.
- System size in kWp, inverter size, yearly kWh, monthly kWh, and winter, summer and yearly average output per day and per square metre.
- A hypothetical house or building drawn from your roof, and a top view plan of the panel layout.
- Charts: monthly production, daily average, roof use, share of your electricity covered, and 25-year cash flow.
- A solar expert review: site and sunlight, orientation, seasons, shading, structure, grid and money.
- The size of solar system that covers 50, 75, 100 and 125 percent of your electricity use.
- A PDF report with a maplity.com letterhead and watermark.
- Tables of solar production per square metre per day for 100 US cities, 100 European cities, 10 Australian cities and 10 UK cities.
How to Use the Roof Solar Calculator: Step by Step
Type your address in the search box and press Search, or press My Location. This solar calculator by address takes you to your building. Zoom in until you can see the roof clearly. The map starts in satellite view, because it is the easiest way to see the roof edges.
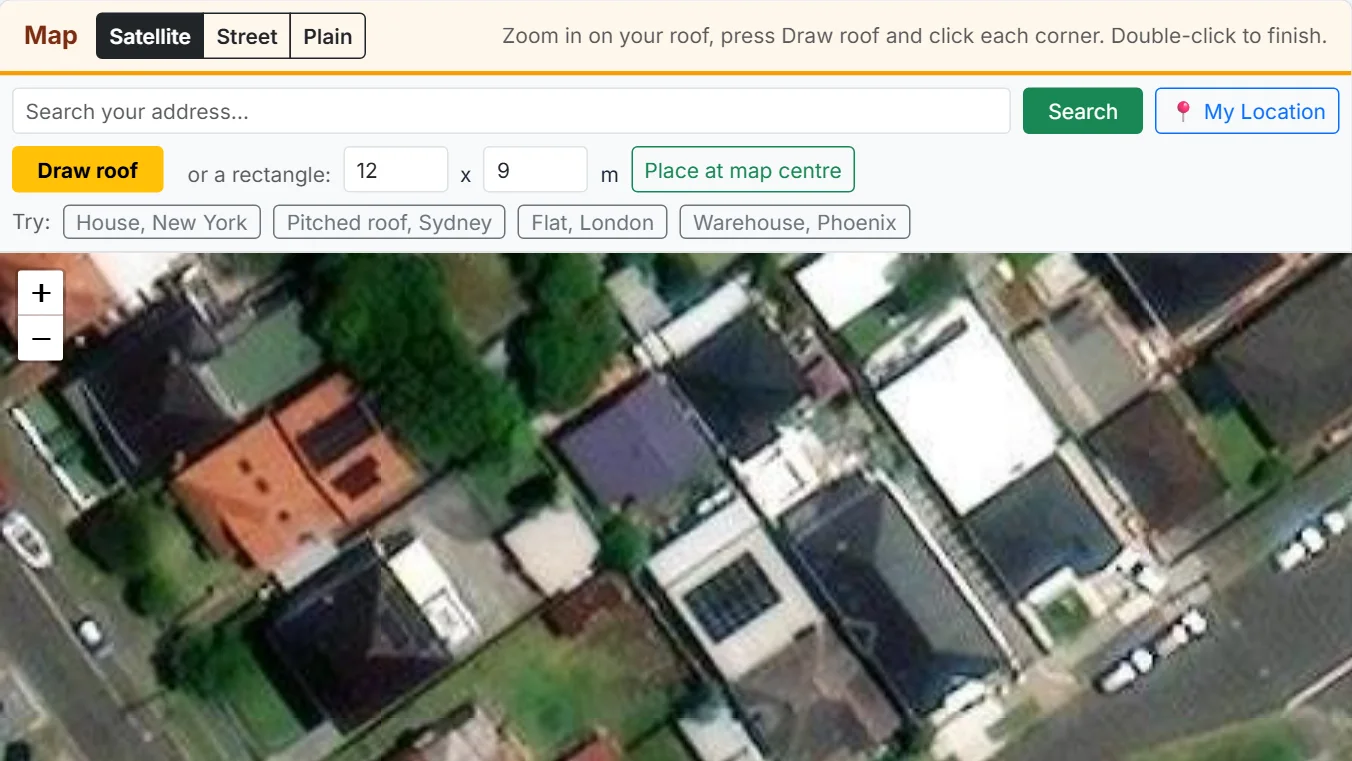
Press Draw roof and click each corner of the roof. Click the first green corner or double-click to finish. The tool measures the rooftop area from your drawing. You can also type a width and a length and press Place at map centre. Drag any corner to fix the shape. The panels appear on the map straight away.
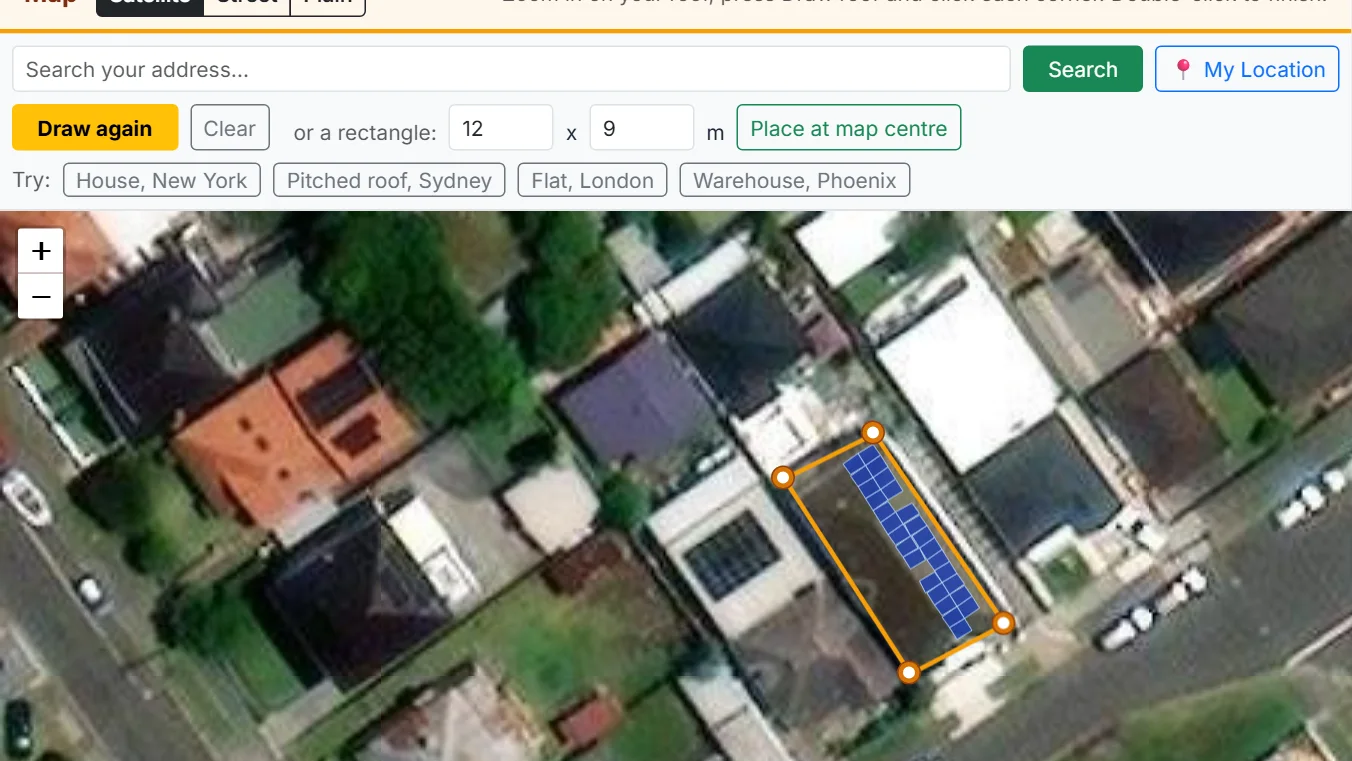
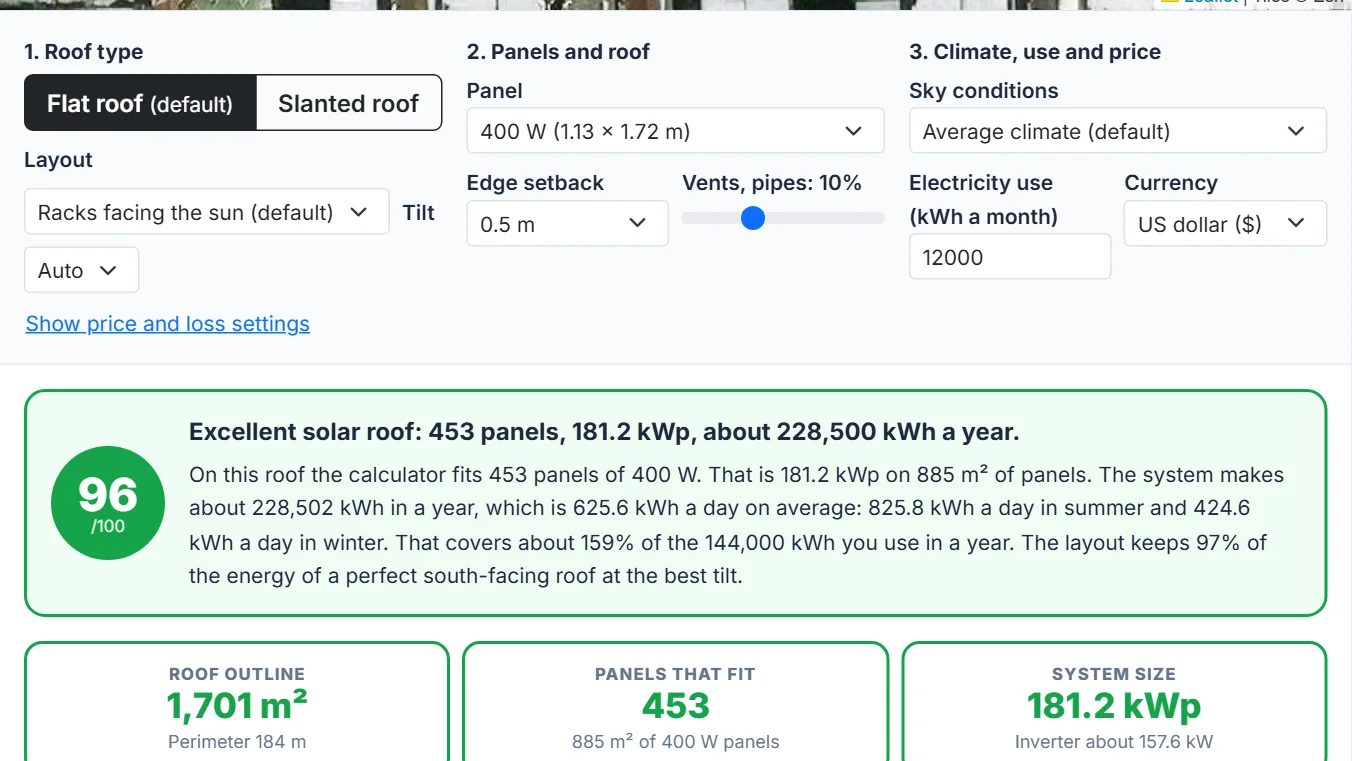
Flat roof is the default. Choose Slanted roof for a tilted, pitched roof and set the slope, to compare the kWh of a tilted roof with a flat roof. Pick the panel size, the edge setback, your monthly electricity use, the currency and the power price. Every change updates the result at once.
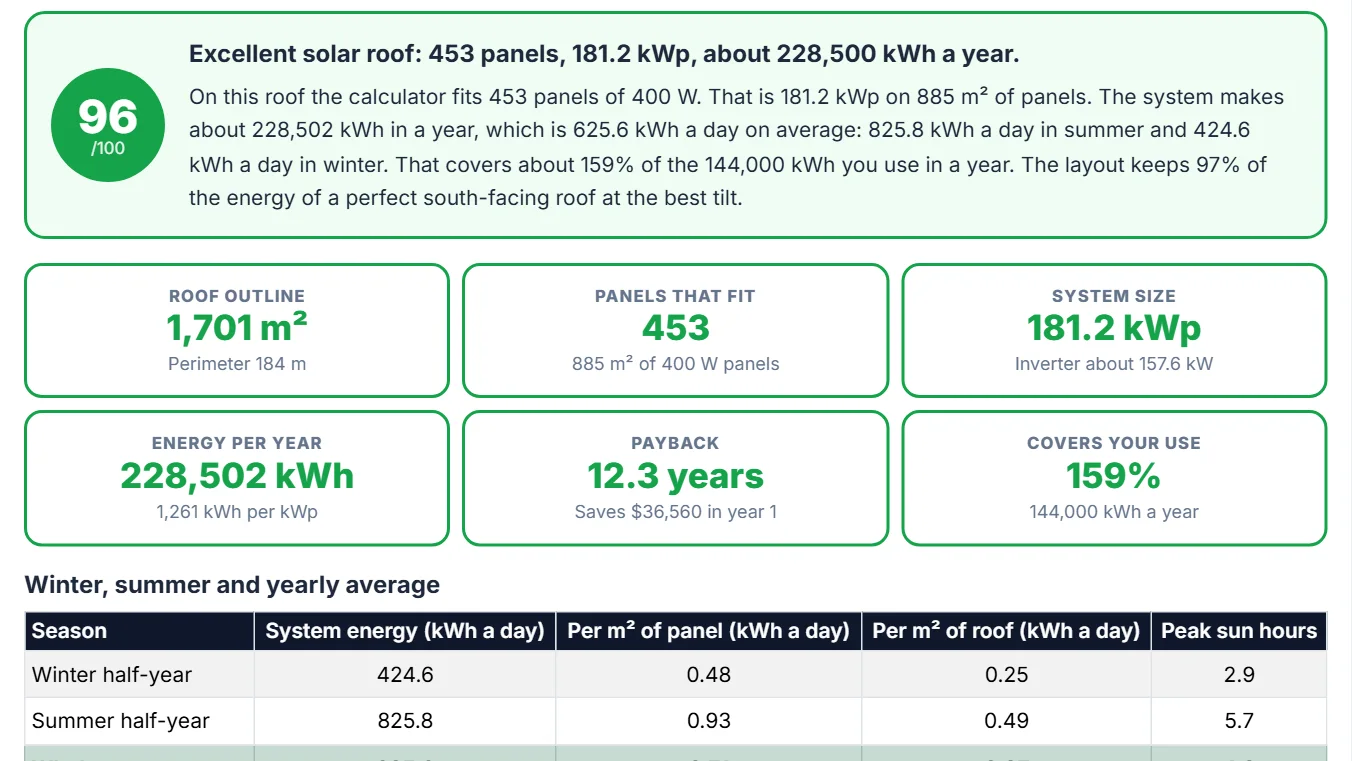
The feasibility score, the number of panels, the system size in kWp, the yearly energy, the payback and the share of your use that solar covers are at the top. The table below shows winter, summer and yearly average output per day and per square metre.
See a hypothetical house or building with your panels on it, the roof plan, the monthly production chart, the cash-flow chart and the size table that shows which system covers your use. Then read the solar expert review written for your roof.
Press Download PDF report to save a multi-page study with a maplity.com letterhead and watermark. It has the pictures, the charts, the tables, the review and the assumptions. Share it with your installer or keep it for your records.
How the Roof Solar Calculator Works
The Worked Examples Use One Roof
This section explains each step from the drawn outline to the kWh, so you can trust the numbers and check them by hand. All examples use the same 12 by 9 metre roof in New York (108 square metres), so you can see how the choices change the result.
From Outline to Panels: How Many Solar Panels on My Roof?
The corners you click are latitude and longitude points. The tool converts them to metres, computes the area with the polygon formula, and finds the smallest rectangle that fits the outline. That rectangle gives the long side, which becomes the ridge line of a slanted roof. Then it places panels on a grid, one panel size at a time. A panel spot counts only if the whole panel is inside the outline and at least the setback (0.5 metres by default) away from every edge. A share of the spots (10 percent by default) is removed for vents, pipes, chimneys and skylights. The tool tries portrait and landscape panels and a few grid positions, and keeps the layout that fits the most panels.
Flat Roofs: Racks and Row Spacing
On a flat roof you choose the angle, so the panels sit on racks. A steeper rack makes more energy in winter, but it casts a longer shadow, so the rows must be farther apart. The row spacing is set so that one row does not shade the next at 10:00 on the winter solstice, the day and time most designers use:
- Row depth in plan: d = L x cos(tilt)
- Shadow length across the rows: s = L x sin(tilt) / tan(sun height) x cos(sun direction from south)
- Row spacing: pitch = d + s. Ground coverage ratio = d / pitch
Flat Roofs: Example Numbers
For the example roof the racks are at 15° and the rows are 2.73 metres apart, a ground coverage ratio of 61 percent. That fits 24 panels, 9.6 kWp. In the east-west layout the panels sit back to back at 10 degrees. The rows almost touch (ground coverage 92 percent), so 32 panels fit, 12.8 kWp.
Slanted Roofs: Slope and Direction
On a slanted roof the panels lie on the tiles, so the roof decides both the tilt and the direction. The tool models a gable roof with the ridge along the longest side of your outline (you can change the ridge direction). It finds the direction each slope faces, keeps 0.3 metres free at the ridge and the setback at the eaves and sides, and places panels on each slope that does not face away from the sun. The roof surface is larger than the drawn outline: surface = outline area / cos(slope). For 30 degrees that is 15 percent more.
Slanted Roofs: Why the Ridge Direction Matters
On the New York example roof with the ridge running east to west, only the south slope is used and it holds 16 panels. Turn the roof so the ridge runs north to south and the two slopes face east and west: 32 panels fit, but each makes about 16 percent less energy.
The Sunlight Model of the Solar Energy Calculator by Location
The sunlight on each roof face comes from a standard method in solar engineering textbooks. For the average day of every month the tool does this:
- It finds the sunlight above the atmosphere from the latitude and the sun declination, and the day length.
- It lowers that light with a clear-sky atmosphere model, then with a cloud factor from your sky setting (sunny, average or cloudy).
- It splits the daily light into direct beam and diffuse light, and spreads both across the hours of the day.
- For every hour it works out how directly the sun hits the roof face, using the face tilt and its compass direction, and adds diffuse sky light and light reflected from the ground.
- It adds the hours to get kWh per square metre per day on the roof face. This number is the same as the peak sun hours.
From Sunlight to Energy: The Formula
The energy of a roof face in one month is:
Performance Ratio and System Losses
The performance ratio (80 percent by default) collects the losses between the sunlight on the panel and the electricity you can use:
| Loss | Typical size | What causes it |
|---|---|---|
| Panel temperature | 4 to 8% | Silicon panels lose about 0.35% of power for each degree Celsius above 25°C. Hot roofs lose more. |
| Inverter | 2 to 4% | Turning direct current into alternating current is 96 to 98% efficient. |
| Wiring and connections | 1 to 2% | Cable resistance and connectors. |
| Dirt, dust and snow | 1 to 4% | Rain cleans tilted panels. Dry, dusty places and low tilts lose more. |
| Mismatch and ageing | 1 to 3% | Small differences between panels, and slow yearly decline of about 0.5%. |
Worked Energy Example
For the example roof, 24 panels of 400 W make 9.6 kWp. The average peak sun hours are about 4.4 a day, so the yearly energy is about 9.6 x 4.4 x 0.8 x 365 = 12,301 kWh. That is 1,281 kWh for each kWp, and 33.7 kWh a day on average.
Example Roofs: Hypothetical Building and Roof Plan Pictures
Example 1: Flat Roof with Racks Facing the Sun
The picture shows the 12 by 9 metre New York example roof as a hypothetical building, and the plan below it shows where the 24 panels sit on the roof. The tool draws the same two pictures for your roof.
Example 2: Flat Roof with an East-West Layout
On the same roof, the east-west layout puts the panels back to back at 10 degrees, so 32 panels fit instead of 24.
Example 3: Slanted Roof at 30 Degrees
With a 30 degree slanted roof and the ridge running east to west, the south slope holds 16 panels and the north slope stays empty.
How Much Roof Space for Solar Panels? Roof Area to Solar Panel Capacity Calculator
Roof Space per Panel and per kWp
The roof space you need depends on the system size and on the roof type. One 400 W panel measures about 1.13 by 1.72 metres, which is 1.95 square metres, so 1 kWp of panels covers about 4.9 square metres. But not all of a roof can hold panels. You keep a safe distance from the edges, a share of the roof is lost to vents and pipes, and on a flat roof the rows need gaps so they do not shade each other. Use it as a solar panel roof space calculator: divide your roof area by the roof space per kWp to get the system size, or divide your wanted system size by the panels per 100 square metres.
Roof Space by Roof Type: Four Layouts on One Roof
The table shows what happens on the same 108 square metre footprint in New York.
| Roof type and layout | Panels | Panels per 100 m² of roof | Roof space per kWp | Share of roof covered by panels |
|---|---|---|---|---|
| Flat roof, racks facing south | 24 | 22.3 | 11.2 m² | 43% |
| Flat roof, east-west layout | 32 | 29.7 | 8.4 m² | 58% |
| Slanted roof, ridge east to west (30°) | 16 | 14.8 | 16.8 m² | 25% |
| Slanted roof, ridge north to south (30°) | 32 | 29.7 | 8.4 m² | 50% |
Rules of Thumb for Roof Space
The figures use the drawn footprint of the roof. As a rule, plan on about 8 to 17 square metres of footprint for each kWp on a slanted roof (about 8 when both slopes face the sun well, and up to 17 when only one slope does), about 10 to 16 square metres of flat roof for each kWp with racks facing the sun, and about 7 to 9 square metres of flat roof for each kWp with an east-west layout. A typical home system of 5 to 8 kWp needs about 40 to 130 square metres of roof, depending on the roof type. To see the number for your own building, draw it in the calculator above.
Tilted Roof vs Flat Roof Solar Panel kWh Calculator: Which Is Better?
Flat Roof or Tilted Roof: The Trade-off
Neither is better in every case. A flat roof gives you freedom: you choose the direction and the angle. A slanted roof is simpler and cheaper to fit, but the roof decides the direction. The table compares four layouts on the same 108 square metre footprint in New York, with the same panels and the same losses.
Four Layouts on the Same Roof: kWh Compared
| Layout | Panels | System (kWp) | Energy (kWh a year) | kWh per kWp | Winter kWh a day | Summer kWh a day |
|---|---|---|---|---|---|---|
| Flat roof, racks facing south | 24 | 9.6 | 12,301 | 1,281 | 23.4 | 44.0 |
| Flat roof, east-west layout | 32 | 12.8 | 15,023 | 1,174 | 25.5 | 56.7 |
| Slanted roof, ridge east to west (30°) | 16 | 6.4 | 8,443 | 1,319 | 17.5 | 28.7 |
| Slanted roof, ridge north to south (30°) | 32 | 12.8 | 14,250 | 1,113 | 24.5 | 53.4 |
How to Choose Between the Layouts
The east-west flat layout and the slanted roof with the ridge running north to south both trade a lower kWh per kWp for more panels. When the roof is small, the number of panels is the limit, so the layout that fits more panels often makes more energy in total. When the roof is large, the layout with the best kWh per kWp is usually better. Try both in the tool with your own roof.
Summer, Winter and Yearly Output: What to Expect
How Solar Output Changes with the Season
Solar output changes with the season, and the change grows with latitude. The tool reports the winter half-year, the summer half-year and the yearly average in kWh per day for the whole system, per square metre of panel and per square metre of roof. In the Northern Hemisphere summer is April to September and winter is October to March. In the Southern Hemisphere they are swapped.
Winter and Summer Output in Three Climates
| Same 108 m² flat roof | Winter kWh a day | Summer kWh a day | Year average kWh a day | Summer to winter |
|---|---|---|---|---|
| Phoenix, sunny | 44.1 | 66.6 | 55.4 | 1.5 to 1 |
| New York, average | 23.4 | 44.0 | 33.7 | 1.9 to 1 |
| London, cloudy | 7.6 | 21.6 | 14.6 | 2.8 to 1 |
What the Season Gap Means for You
Sunny places like Phoenix have a small gap between winter and summer. Cloudy northern places like London have a big gap, and winter output there is low even at the best angle. This is why a grid connection with credits or a battery matters more in the north, and why a system that covers 100 percent of your use over the year does not cover it in every month.
What Size of Solar System Do You Need? Solar Roof Size Calculator
Five Steps to Size a Solar System
Follow these steps to size a system. The solar roof size calculator does them for you and shows the result in a table, together with the roof space you need.
- Find your yearly electricity use in kWh on your bills. For a home, take 12 months. If you plan an electric car or a heat pump, add their expected use.
- Decide how much of it you want solar to cover. 100 percent is common for grid-connected homes. 50 to 75 percent is common when the roof is small or the power price is low.
- Divide by the yearly yield of one kWp on your roof (kWh per kWp). Your roof result in the tool shows this number.
- Divide the kWp by the power of one panel (for example 0.4 kW) and round up to get the number of panels.
- Check that the panels fit on your roof. If they do not, use higher-power panels, an east-west layout, a second roof, or accept a lower share.
Worked Example: A New York Home
A home in New York uses 700 kWh a month, or 8,400 kWh a year. One kWp on the example roof makes about 1,281 kWh a year. The system that covers 100 percent is 8,400 / 1,281 = 6.6 kWp, or 17 panels of 400 W. The roof holds 24, so it fits. The inverter can be about 15 percent smaller than the panel power, so a 6.6 kWp system uses an inverter of about 5.7 kW.
Solar Feasibility: Is Your Roof Good for Solar?
Feasibility Score and Rating
The tool gives a score from 0 to 100 and a rating: Excellent (80 or more), Good (60 to 79), Fair (40 to 59) or Limited (below 40). The score adds four parts.
How the Feasibility Score Is Built
| Part | Points | How it is measured |
|---|---|---|
| Orientation and tilt | 40 | The yield of your roof compared with a perfect roof at the best tilt. 97 percent or more gets full points, 70 percent gets none. |
| Your use covered | 30 | The share of your yearly electricity use that the roof can produce. |
| Yield level | 20 | Yearly kWh per kWp: 1,400 or more gets full points and 700 gets none. |
| Roof size | 10 | At least 6 panels fit. |
What the Feasibility Score Does Not Cover
The score is a first filter, not a design. A high score means the geometry and the sunlight are good. It does not know about shade from trees, the age of the roof, or the strength of the structure. Read the written review under the result for the points that need a site visit.
Cost, Savings and Payback
How Cost and Savings Are Worked Out
The tool multiplies the system size by an installed price per watt to get the cost, and multiplies the yearly energy by the power price to get the savings. The starting prices depend on the region and are only a guide. Change them in the price settings to match your quotes and your tariff.
Starting Prices by Region
| Region | Installed price per watt | Power price per kWh |
|---|---|---|
| USA | $2.60 | $0.16 |
| Europe | €1.60 | €0.30 |
| United Kingdom | £1.80 | £0.28 |
| Australia | A$1.50 | A$0.30 |
Payback of the Example Roof
The payback is worked out year by year for 25 years. The power price rises 3 percent a year, the panels lose 0.5 percent of their output a year, and the inverter is replaced in year 12 for 10 percent of the system cost. For the example roof the system costs about $24,960, saves about $1,968 in year 1 and pays back in about 12.1 years. Over 25 years the net gain is about $39,644.
Solar Panel Production by City: kWh per Square Metre per Day in Winter, Summer and the Whole Year
How the City Numbers Are Calculated
These tables list how much electricity one square metre of solar panel makes per day in 100 US cities, 100 European cities, 10 Australian cities and 10 UK cities. The numbers assume panels at the best fixed tilt facing the equator, 20 percent panel efficiency and a performance ratio of 80 percent, with the typical climate of the city. Winter and summer are half-years: summer is April to September in the Northern Hemisphere and October to March in the Southern Hemisphere. To get the energy of your own roof, multiply the whole-year figure by the panel area, or draw your roof in the tool above.
Solar Panel Production in 100 Small and Large US Cities
| # | City | State | Latitude | Climate | Winter kWh/m²/day | Summer kWh/m²/day | Whole-year kWh/m²/day | Whole-year kWh/m²/year |
|---|---|---|---|---|---|---|---|---|
| 1 | New York | NY | 40.71° N | Average | 0.57 | 0.88 | 0.73 | 265 |
| 2 | Los Angeles | CA | 34.05° N | Sunny | 0.93 | 1.18 | 1.05 | 384 |
| 3 | Chicago | IL | 41.88° N | Average | 0.56 | 0.88 | 0.72 | 262 |
| 4 | Houston | TX | 29.76° N | Average | 0.70 | 0.91 | 0.80 | 293 |
| 5 | Phoenix | AZ | 33.45° N | Sunny | 0.94 | 1.18 | 1.06 | 386 |
| 6 | Philadelphia | PA | 39.95° N | Average | 0.58 | 0.88 | 0.73 | 267 |
| 7 | San Antonio | TX | 29.42° N | Sunny | 0.98 | 1.18 | 1.08 | 396 |
| 8 | San Diego | CA | 32.72° N | Sunny | 0.94 | 1.18 | 1.06 | 387 |
| 9 | Dallas | TX | 32.78° N | Average | 0.66 | 0.90 | 0.78 | 286 |
| 10 | San Jose | CA | 37.34° N | Sunny | 0.88 | 1.17 | 1.03 | 375 |
| 11 | Austin | TX | 30.27° N | Average | 0.69 | 0.91 | 0.80 | 292 |
| 12 | Jacksonville | FL | 30.33° N | Average | 0.69 | 0.91 | 0.80 | 291 |
| 13 | San Francisco | CA | 37.77° N | Average | 0.61 | 0.89 | 0.75 | 273 |
| 14 | Columbus | OH | 39.96° N | Average | 0.58 | 0.88 | 0.73 | 267 |
| 15 | Indianapolis | IN | 39.77° N | Average | 0.58 | 0.88 | 0.73 | 268 |
| 16 | Fort Worth | TX | 32.76° N | Average | 0.66 | 0.90 | 0.78 | 286 |
| 17 | Charlotte | NC | 35.23° N | Average | 0.64 | 0.90 | 0.77 | 280 |
| 18 | Seattle | WA | 47.61° N | Cloudy | 0.34 | 0.67 | 0.51 | 185 |
| 19 | Denver | CO | 39.74° N | Sunny | 0.85 | 1.16 | 1.00 | 367 |
| 20 | Washington | DC | 38.91° N | Average | 0.59 | 0.89 | 0.74 | 270 |
| 21 | Boston | MA | 42.36° N | Average | 0.55 | 0.88 | 0.71 | 260 |
| 22 | El Paso | TX | 31.76° N | Sunny | 0.95 | 1.18 | 1.07 | 390 |
| 23 | Nashville | TN | 36.16° N | Average | 0.63 | 0.89 | 0.76 | 278 |
| 24 | Detroit | MI | 42.33° N | Cloudy | 0.40 | 0.69 | 0.55 | 199 |
| 25 | Oklahoma City | OK | 35.47° N | Average | 0.63 | 0.90 | 0.77 | 280 |
| 26 | Portland | OR | 45.52° N | Cloudy | 0.36 | 0.68 | 0.52 | 191 |
| 27 | Las Vegas | NV | 36.17° N | Sunny | 0.90 | 1.17 | 1.04 | 378 |
| 28 | Memphis | TN | 35.15° N | Average | 0.64 | 0.90 | 0.77 | 280 |
| 29 | Louisville | KY | 38.25° N | Average | 0.60 | 0.89 | 0.74 | 272 |
| 30 | Baltimore | MD | 39.29° N | Average | 0.59 | 0.89 | 0.74 | 269 |
| 31 | Milwaukee | WI | 43.04° N | Average | 0.54 | 0.87 | 0.71 | 258 |
| 32 | Albuquerque | NM | 35.08° N | Sunny | 0.91 | 1.17 | 1.04 | 381 |
| 33 | Tucson | AZ | 32.22° N | Sunny | 0.95 | 1.18 | 1.06 | 389 |
| 34 | Fresno | CA | 36.74° N | Sunny | 0.89 | 1.17 | 1.03 | 376 |
| 35 | Sacramento | CA | 38.58° N | Sunny | 0.86 | 1.17 | 1.01 | 371 |
| 36 | Kansas City | MO | 39.10° N | Average | 0.59 | 0.89 | 0.74 | 270 |
| 37 | Atlanta | GA | 33.75° N | Average | 0.65 | 0.90 | 0.78 | 284 |
| 38 | Omaha | NE | 41.26° N | Average | 0.56 | 0.88 | 0.72 | 263 |
| 39 | Colorado Springs | CO | 38.83° N | Sunny | 0.86 | 1.17 | 1.01 | 370 |
| 40 | Raleigh | NC | 35.78° N | Average | 0.63 | 0.89 | 0.76 | 279 |
| 41 | Miami | FL | 25.76° N | Average | 0.74 | 0.91 | 0.82 | 301 |
| 42 | Minneapolis | MN | 44.98° N | Average | 0.51 | 0.87 | 0.69 | 252 |
| 43 | Tampa | FL | 27.95° N | Average | 0.71 | 0.91 | 0.81 | 296 |
| 44 | New Orleans | LA | 29.95° N | Average | 0.69 | 0.91 | 0.80 | 292 |
| 45 | Salt Lake City | UT | 40.76° N | Sunny | 0.83 | 1.16 | 0.99 | 363 |
| 46 | Honolulu | HI | 21.31° N | Sunny | 1.06 | 1.19 | 1.12 | 411 |
| 47 | Anchorage | AK | 61.22° N | Cloudy | 0.17 | 0.60 | 0.39 | 141 |
| 48 | Pittsburgh | PA | 40.44° N | Cloudy | 0.42 | 0.70 | 0.56 | 204 |
| 49 | Cleveland | OH | 41.50° N | Cloudy | 0.41 | 0.70 | 0.55 | 202 |
| 50 | St. Louis | MO | 38.63° N | Average | 0.60 | 0.89 | 0.74 | 271 |
| 51 | Tulsa | OK | 36.15° N | Average | 0.63 | 0.89 | 0.76 | 278 |
| 52 | Wichita | KS | 37.69° N | Average | 0.61 | 0.89 | 0.75 | 274 |
| 53 | Bakersfield | CA | 35.37° N | Sunny | 0.91 | 1.17 | 1.04 | 381 |
| 54 | Aurora | CO | 39.73° N | Sunny | 0.85 | 1.16 | 1.00 | 367 |
| 55 | Anaheim | CA | 33.84° N | Sunny | 0.93 | 1.18 | 1.05 | 385 |
| 56 | Riverside | CA | 33.95° N | Sunny | 0.93 | 1.18 | 1.05 | 385 |
| 57 | Corpus Christi | TX | 27.80° N | Average | 0.72 | 0.91 | 0.81 | 297 |
| 58 | Lexington | KY | 38.04° N | Average | 0.60 | 0.89 | 0.75 | 273 |
| 59 | Stockton | CA | 37.96° N | Sunny | 0.87 | 1.17 | 1.02 | 373 |
| 60 | Henderson | NV | 36.04° N | Sunny | 0.90 | 1.17 | 1.04 | 379 |
| 61 | Saint Paul | MN | 44.95° N | Average | 0.51 | 0.87 | 0.69 | 252 |
| 62 | Cincinnati | OH | 39.10° N | Average | 0.59 | 0.89 | 0.74 | 270 |
| 63 | St. Petersburg | FL | 27.77° N | Average | 0.72 | 0.91 | 0.81 | 297 |
| 64 | Greensboro | NC | 36.07° N | Average | 0.63 | 0.89 | 0.76 | 278 |
| 65 | Newark | NJ | 40.74° N | Average | 0.57 | 0.88 | 0.73 | 265 |
| 66 | Lincoln | NE | 40.81° N | Average | 0.57 | 0.88 | 0.72 | 265 |
| 67 | Toledo | OH | 41.65° N | Cloudy | 0.40 | 0.70 | 0.55 | 201 |
| 68 | Orlando | FL | 28.54° N | Average | 0.71 | 0.91 | 0.81 | 295 |
| 69 | Chandler | AZ | 33.31° N | Sunny | 0.94 | 1.18 | 1.06 | 386 |
| 70 | Fort Wayne | IN | 41.08° N | Cloudy | 0.41 | 0.70 | 0.55 | 203 |
| 71 | Buffalo | NY | 42.89° N | Cloudy | 0.39 | 0.69 | 0.54 | 198 |
| 72 | Durham | NC | 35.99° N | Average | 0.63 | 0.89 | 0.76 | 278 |
| 73 | Madison | WI | 43.07° N | Average | 0.54 | 0.87 | 0.71 | 258 |
| 74 | Lubbock | TX | 33.58° N | Sunny | 0.93 | 1.18 | 1.06 | 386 |
| 75 | Scottsdale | AZ | 33.49° N | Sunny | 0.93 | 1.18 | 1.06 | 386 |
| 76 | Reno | NV | 39.53° N | Sunny | 0.85 | 1.17 | 1.01 | 368 |
| 77 | Norfolk | VA | 36.85° N | Average | 0.62 | 0.89 | 0.76 | 276 |
| 78 | Boise | ID | 43.62° N | Sunny | 0.78 | 1.15 | 0.97 | 353 |
| 79 | Richmond | VA | 37.54° N | Average | 0.61 | 0.89 | 0.75 | 274 |
| 80 | Spokane | WA | 47.66° N | Average | 0.47 | 0.85 | 0.66 | 243 |
| 81 | Des Moines | IA | 41.59° N | Average | 0.56 | 0.88 | 0.72 | 263 |
| 82 | Birmingham | AL | 33.52° N | Average | 0.66 | 0.90 | 0.78 | 284 |
| 83 | Rochester | NY | 43.16° N | Cloudy | 0.39 | 0.69 | 0.54 | 197 |
| 84 | Boulder | CO | 40.01° N | Sunny | 0.84 | 1.16 | 1.00 | 366 |
| 85 | Santa Fe | NM | 35.69° N | Sunny | 0.91 | 1.17 | 1.04 | 380 |
| 86 | Charleston | SC | 32.78° N | Average | 0.66 | 0.90 | 0.78 | 286 |
| 87 | Savannah | GA | 32.08° N | Average | 0.67 | 0.90 | 0.79 | 287 |
| 88 | Burlington | VT | 44.48° N | Cloudy | 0.37 | 0.69 | 0.53 | 194 |
| 89 | Portland | ME | 43.66° N | Average | 0.53 | 0.87 | 0.70 | 256 |
| 90 | Fargo | ND | 46.88° N | Average | 0.49 | 0.86 | 0.67 | 245 |
| 91 | Billings | MT | 45.78° N | Average | 0.50 | 0.86 | 0.68 | 249 |
| 92 | Cheyenne | WY | 41.14° N | Sunny | 0.82 | 1.16 | 0.99 | 362 |
| 93 | Sioux Falls | SD | 43.55° N | Average | 0.53 | 0.87 | 0.70 | 256 |
| 94 | Little Rock | AR | 34.75° N | Average | 0.64 | 0.90 | 0.77 | 281 |
| 95 | Jackson | MS | 32.30° N | Average | 0.67 | 0.90 | 0.79 | 287 |
| 96 | Baton Rouge | LA | 30.45° N | Average | 0.69 | 0.91 | 0.80 | 291 |
| 97 | Charleston | WV | 38.35° N | Cloudy | 0.44 | 0.71 | 0.57 | 209 |
| 98 | Wilmington | DE | 39.74° N | Average | 0.58 | 0.88 | 0.73 | 268 |
| 99 | Providence | RI | 41.82° N | Average | 0.56 | 0.88 | 0.72 | 262 |
| 100 | Juneau | AK | 58.30° N | Cloudy | 0.20 | 0.62 | 0.41 | 150 |
Solar Panel Production in 100 European Cities
| # | City | Country | Latitude | Climate | Winter kWh/m²/day | Summer kWh/m²/day | Whole-year kWh/m²/day | Whole-year kWh/m²/year |
|---|---|---|---|---|---|---|---|---|
| 1 | London | United Kingdom | 51.51° N | Cloudy | 0.29 | 0.66 | 0.47 | 173 |
| 2 | Paris | France | 48.86° N | Average | 0.46 | 0.85 | 0.65 | 238 |
| 3 | Berlin | Germany | 52.52° N | Cloudy | 0.28 | 0.65 | 0.46 | 169 |
| 4 | Madrid | Spain | 40.42° N | Sunny | 0.83 | 1.16 | 1.00 | 364 |
| 5 | Rome | Italy | 41.90° N | Sunny | 0.81 | 1.16 | 0.98 | 360 |
| 6 | Barcelona | Spain | 41.39° N | Sunny | 0.82 | 1.16 | 0.99 | 361 |
| 7 | Vienna | Austria | 48.21° N | Average | 0.46 | 0.85 | 0.66 | 241 |
| 8 | Amsterdam | Netherlands | 52.37° N | Cloudy | 0.28 | 0.65 | 0.46 | 170 |
| 9 | Brussels | Belgium | 50.85° N | Cloudy | 0.30 | 0.66 | 0.48 | 175 |
| 10 | Lisbon | Portugal | 38.72° N | Sunny | 0.86 | 1.17 | 1.01 | 370 |
| 11 | Athens | Greece | 37.98° N | Sunny | 0.87 | 1.17 | 1.02 | 373 |
| 12 | Dublin | Ireland | 53.35° N | Cloudy | 0.27 | 0.65 | 0.46 | 167 |
| 13 | Stockholm | Sweden | 59.33° N | Cloudy | 0.19 | 0.61 | 0.40 | 147 |
| 14 | Oslo | Norway | 59.91° N | Cloudy | 0.18 | 0.61 | 0.40 | 145 |
| 15 | Copenhagen | Denmark | 55.68° N | Cloudy | 0.24 | 0.63 | 0.44 | 159 |
| 16 | Helsinki | Finland | 60.17° N | Cloudy | 0.18 | 0.61 | 0.39 | 144 |
| 17 | Warsaw | Poland | 52.23° N | Cloudy | 0.28 | 0.65 | 0.47 | 170 |
| 18 | Prague | Czechia | 50.08° N | Average | 0.44 | 0.84 | 0.64 | 234 |
| 19 | Budapest | Hungary | 47.50° N | Average | 0.48 | 0.85 | 0.67 | 243 |
| 20 | Munich | Germany | 48.14° N | Average | 0.47 | 0.85 | 0.66 | 241 |
| 21 | Hamburg | Germany | 53.55° N | Cloudy | 0.26 | 0.65 | 0.45 | 166 |
| 22 | Frankfurt | Germany | 50.11° N | Average | 0.44 | 0.84 | 0.64 | 234 |
| 23 | Cologne | Germany | 50.94° N | Cloudy | 0.30 | 0.66 | 0.48 | 174 |
| 24 | Zurich | Switzerland | 47.38° N | Average | 0.48 | 0.86 | 0.67 | 244 |
| 25 | Geneva | Switzerland | 46.20° N | Average | 0.50 | 0.86 | 0.68 | 248 |
| 26 | Milan | Italy | 45.46° N | Average | 0.51 | 0.86 | 0.68 | 250 |
| 27 | Naples | Italy | 40.85° N | Sunny | 0.83 | 1.16 | 0.99 | 363 |
| 28 | Turin | Italy | 45.07° N | Average | 0.51 | 0.86 | 0.69 | 251 |
| 29 | Florence | Italy | 43.77° N | Sunny | 0.78 | 1.15 | 0.97 | 353 |
| 30 | Venice | Italy | 45.44° N | Average | 0.51 | 0.86 | 0.69 | 250 |
| 31 | Palermo | Italy | 38.12° N | Sunny | 0.87 | 1.17 | 1.02 | 372 |
| 32 | Seville | Spain | 37.39° N | Sunny | 0.88 | 1.17 | 1.03 | 374 |
| 33 | Valencia | Spain | 39.47° N | Sunny | 0.85 | 1.16 | 1.01 | 368 |
| 34 | Malaga | Spain | 36.72° N | Sunny | 0.89 | 1.17 | 1.03 | 377 |
| 35 | Porto | Portugal | 41.15° N | Average | 0.56 | 0.88 | 0.72 | 264 |
| 36 | Marseille | France | 43.30° N | Sunny | 0.79 | 1.15 | 0.97 | 355 |
| 37 | Lyon | France | 45.76° N | Average | 0.50 | 0.86 | 0.68 | 249 |
| 38 | Nice | France | 43.70° N | Sunny | 0.78 | 1.15 | 0.97 | 353 |
| 39 | Edinburgh | United Kingdom | 55.95° N | Cloudy | 0.23 | 0.63 | 0.43 | 158 |
| 40 | Manchester | United Kingdom | 53.48° N | Cloudy | 0.26 | 0.65 | 0.46 | 166 |
| 41 | Glasgow | United Kingdom | 55.86° N | Cloudy | 0.23 | 0.63 | 0.43 | 158 |
| 42 | Birmingham | United Kingdom | 52.49° N | Cloudy | 0.28 | 0.65 | 0.46 | 169 |
| 43 | Reykjavik | Iceland | 64.15° N | Cloudy | 0.14 | 0.58 | 0.36 | 131 |
| 44 | Bucharest | Romania | 44.43° N | Average | 0.52 | 0.87 | 0.69 | 254 |
| 45 | Sofia | Bulgaria | 42.70° N | Average | 0.54 | 0.87 | 0.71 | 259 |
| 46 | Belgrade | Serbia | 44.79° N | Average | 0.52 | 0.87 | 0.69 | 252 |
| 47 | Zagreb | Croatia | 45.81° N | Average | 0.50 | 0.86 | 0.68 | 249 |
| 48 | Kyiv | Ukraine | 50.45° N | Average | 0.43 | 0.84 | 0.64 | 232 |
| 49 | Moscow | Russia | 55.76° N | Cloudy | 0.24 | 0.63 | 0.43 | 159 |
| 50 | Valletta | Malta | 35.90° N | Sunny | 0.90 | 1.17 | 1.04 | 379 |
| 51 | Stuttgart | Germany | 48.78° N | Average | 0.46 | 0.85 | 0.65 | 238 |
| 52 | Dusseldorf | Germany | 51.23° N | Cloudy | 0.29 | 0.66 | 0.47 | 173 |
| 53 | Dresden | Germany | 51.05° N | Average | 0.42 | 0.84 | 0.63 | 230 |
| 54 | Leipzig | Germany | 51.34° N | Average | 0.42 | 0.84 | 0.63 | 229 |
| 55 | Nuremberg | Germany | 49.45° N | Average | 0.45 | 0.84 | 0.65 | 236 |
| 56 | Bremen | Germany | 53.08° N | Cloudy | 0.27 | 0.65 | 0.46 | 168 |
| 57 | Hanover | Germany | 52.37° N | Cloudy | 0.28 | 0.65 | 0.46 | 170 |
| 58 | Bologna | Italy | 44.49° N | Average | 0.52 | 0.87 | 0.69 | 253 |
| 59 | Genoa | Italy | 44.41° N | Sunny | 0.77 | 1.15 | 0.96 | 350 |
| 60 | Bari | Italy | 41.12° N | Sunny | 0.82 | 1.16 | 0.99 | 362 |
| 61 | Catania | Italy | 37.50° N | Sunny | 0.88 | 1.17 | 1.02 | 374 |
| 62 | Verona | Italy | 45.44° N | Average | 0.51 | 0.86 | 0.69 | 250 |
| 63 | Zaragoza | Spain | 41.65° N | Sunny | 0.82 | 1.16 | 0.99 | 361 |
| 64 | Bilbao | Spain | 43.26° N | Average | 0.54 | 0.87 | 0.70 | 257 |
| 65 | Granada | Spain | 37.18° N | Sunny | 0.88 | 1.17 | 1.03 | 375 |
| 66 | Murcia | Spain | 37.99° N | Sunny | 0.87 | 1.17 | 1.02 | 373 |
| 67 | Alicante | Spain | 38.35° N | Sunny | 0.87 | 1.17 | 1.02 | 371 |
| 68 | Palma | Spain | 39.57° N | Sunny | 0.85 | 1.17 | 1.01 | 367 |
| 69 | Cordoba | Spain | 37.89° N | Sunny | 0.87 | 1.17 | 1.02 | 373 |
| 70 | Coimbra | Portugal | 40.21° N | Average | 0.58 | 0.88 | 0.73 | 266 |
| 71 | Faro | Portugal | 37.02° N | Sunny | 0.89 | 1.17 | 1.03 | 376 |
| 72 | Toulouse | France | 43.60° N | Average | 0.53 | 0.87 | 0.70 | 256 |
| 73 | Bordeaux | France | 44.84° N | Average | 0.51 | 0.87 | 0.69 | 252 |
| 74 | Nantes | France | 47.22° N | Average | 0.48 | 0.86 | 0.67 | 244 |
| 75 | Strasbourg | France | 48.57° N | Average | 0.46 | 0.85 | 0.66 | 239 |
| 76 | Lille | France | 50.63° N | Cloudy | 0.30 | 0.66 | 0.48 | 175 |
| 77 | Montpellier | France | 43.61° N | Sunny | 0.78 | 1.15 | 0.97 | 353 |
| 78 | Antwerp | Belgium | 51.22° N | Cloudy | 0.29 | 0.66 | 0.47 | 173 |
| 79 | Rotterdam | Netherlands | 51.92° N | Cloudy | 0.28 | 0.65 | 0.47 | 171 |
| 80 | The Hague | Netherlands | 52.08° N | Cloudy | 0.28 | 0.65 | 0.47 | 171 |
| 81 | Utrecht | Netherlands | 52.09° N | Cloudy | 0.28 | 0.65 | 0.47 | 171 |
| 82 | Luxembourg | Luxembourg | 49.61° N | Cloudy | 0.31 | 0.66 | 0.49 | 178 |
| 83 | Bern | Switzerland | 46.95° N | Average | 0.48 | 0.86 | 0.67 | 245 |
| 84 | Basel | Switzerland | 47.56° N | Average | 0.48 | 0.85 | 0.66 | 243 |
| 85 | Salzburg | Austria | 47.81° N | Average | 0.47 | 0.85 | 0.66 | 242 |
| 86 | Graz | Austria | 47.07° N | Average | 0.48 | 0.86 | 0.67 | 245 |
| 87 | Gothenburg | Sweden | 57.71° N | Cloudy | 0.21 | 0.62 | 0.42 | 152 |
| 88 | Malmo | Sweden | 55.60° N | Cloudy | 0.24 | 0.63 | 0.44 | 159 |
| 89 | Bergen | Norway | 60.39° N | Cloudy | 0.18 | 0.60 | 0.39 | 143 |
| 90 | Aarhus | Denmark | 56.16° N | Cloudy | 0.23 | 0.63 | 0.43 | 157 |
| 91 | Tallinn | Estonia | 59.44° N | Cloudy | 0.19 | 0.61 | 0.40 | 147 |
| 92 | Riga | Latvia | 56.95° N | Cloudy | 0.22 | 0.63 | 0.42 | 155 |
| 93 | Vilnius | Lithuania | 54.69° N | Cloudy | 0.25 | 0.64 | 0.44 | 162 |
| 94 | Krakow | Poland | 50.06° N | Average | 0.44 | 0.84 | 0.64 | 234 |
| 95 | Gdansk | Poland | 54.35° N | Cloudy | 0.25 | 0.64 | 0.45 | 163 |
| 96 | Bratislava | Slovakia | 48.15° N | Average | 0.47 | 0.85 | 0.66 | 241 |
| 97 | Ljubljana | Slovenia | 46.06° N | Average | 0.50 | 0.86 | 0.68 | 248 |
| 98 | Thessaloniki | Greece | 40.64° N | Sunny | 0.83 | 1.16 | 1.00 | 364 |
| 99 | Nicosia | Cyprus | 35.19° N | Sunny | 0.91 | 1.17 | 1.04 | 381 |
| 100 | Split | Croatia | 43.51° N | Sunny | 0.78 | 1.15 | 0.97 | 354 |
Solar Panel Production in 10 Australian Cities
Australia is in the Southern Hemisphere, so summer is October to March and winter is April to September, and the best panel direction is north.
| # | City | State | Latitude | Climate | Winter kWh/m²/day | Summer kWh/m²/day | Whole-year kWh/m²/day | Whole-year kWh/m²/year |
|---|---|---|---|---|---|---|---|---|
| 1 | Sydney | NSW | 33.87° S | Average | 0.62 | 0.94 | 0.78 | 286 |
| 2 | Melbourne | VIC | 37.81° S | Average | 0.58 | 0.93 | 0.75 | 276 |
| 3 | Brisbane | QLD | 27.47° S | Sunny | 0.96 | 1.24 | 1.10 | 401 |
| 4 | Perth | WA | 31.95° S | Sunny | 0.91 | 1.23 | 1.07 | 391 |
| 5 | Adelaide | SA | 34.93° S | Sunny | 0.87 | 1.23 | 1.05 | 384 |
| 6 | Canberra | ACT | 35.28° S | Sunny | 0.87 | 1.23 | 1.05 | 383 |
| 7 | Hobart | TAS | 42.88° S | Cloudy | 0.37 | 0.72 | 0.55 | 200 |
| 8 | Darwin | NT | 12.46° S | Sunny | 1.08 | 1.23 | 1.16 | 422 |
| 9 | Gold Coast | QLD | 28.02° S | Sunny | 0.95 | 1.24 | 1.10 | 400 |
| 10 | Newcastle | NSW | 32.93° S | Average | 0.63 | 0.94 | 0.79 | 288 |
Solar Panel Production in 10 UK Cities
| # | City | Nation | Latitude | Climate | Winter kWh/m²/day | Summer kWh/m²/day | Whole-year kWh/m²/day | Whole-year kWh/m²/year |
|---|---|---|---|---|---|---|---|---|
| 1 | London | England | 51.51° N | Cloudy | 0.29 | 0.66 | 0.47 | 173 |
| 2 | Birmingham | England | 52.49° N | Cloudy | 0.28 | 0.65 | 0.46 | 169 |
| 3 | Manchester | England | 53.48° N | Cloudy | 0.26 | 0.65 | 0.46 | 166 |
| 4 | Liverpool | England | 53.41° N | Cloudy | 0.26 | 0.65 | 0.46 | 166 |
| 5 | Bristol | England | 51.45° N | Cloudy | 0.29 | 0.66 | 0.47 | 173 |
| 6 | Leeds | England | 53.80° N | Cloudy | 0.26 | 0.64 | 0.45 | 165 |
| 7 | Glasgow | Scotland | 55.86° N | Cloudy | 0.23 | 0.63 | 0.43 | 158 |
| 8 | Edinburgh | Scotland | 55.95° N | Cloudy | 0.23 | 0.63 | 0.43 | 158 |
| 9 | Cardiff | Wales | 51.48° N | Cloudy | 0.29 | 0.66 | 0.47 | 173 |
| 10 | Belfast | Northern Ireland | 54.60° N | Cloudy | 0.25 | 0.64 | 0.45 | 163 |
How Accurate Is the Roof Solar Calculator?
Accuracy of the Outline and of the Energy
The geometry is exact for the outline you draw, with the accuracy of the satellite image (a few metres at the edges, a few tens of centimetres if you zoom in and draw with care). The panel count follows real panel sizes and setbacks. The energy is a good planning estimate: it uses solar geometry and a clear-sky model with a cloud setting, and it is usually within about 10 percent of professional tools for an open roof.
What Is Not Included, and How to Check
It does not include shade from trees and neighbouring buildings, real weather years, snow cover or dirt. For a quote-grade estimate, compare your result with the free NREL PVWatts tool (USA) or PVGIS (Europe and other regions), and ask a certified installer for a site survey.
10 Most Asked Questions About Solar Panels on a Roof
How many solar panels can I fit on my roof?
What size of solar system (kW) do I need?
How much energy does a solar panel make per square metre per day?
Tilted roof vs flat roof: which gives more solar panel kWh?
What is the best roof direction and slope for solar panels?
How much does a roof solar system cost, and how long is the payback?
How different are summer and winter output?
How much roof space for solar panels do I need per kW?
How accurate is this free roof solar calculator?
What should I check before I install solar panels on my roof?
Method, Sources and Credits
Method and Data Sources
- Solar geometry and monthly-average method: Duffie and Beckman, Solar Engineering of Thermal Processes.
- Clear-sky atmosphere: Hottel (1976). Diffuse fraction: Erbs, Klein and Duffie (1982). Hourly split: Collares-Pereira and Rabl (1979). Tilted surface radiation: Liu and Jordan (1963).
- Map: Leaflet. Place search: Nominatim and OpenStreetMap contributors.
- Satellite images and street maps: Esri, CARTO and OpenStreetMap. PDF files are created in your browser with jsPDF, and your roof outline is not stored.