Contours to DEM Converter: From Lines to a Surface
What a DEM Is
A digital elevation model (DEM) is a grid of heights. The land is cut into square cells, and each cell holds one height above sea level. Contour lines show the same land as lines of equal height, which is easy for people to read. A DEM is easier for computers: GIS programs need it to draw hillshade, measure slope and aspect, trace where water flows, check what can be seen from a point and build 3D views.
What This Contours to DEM Tool Does
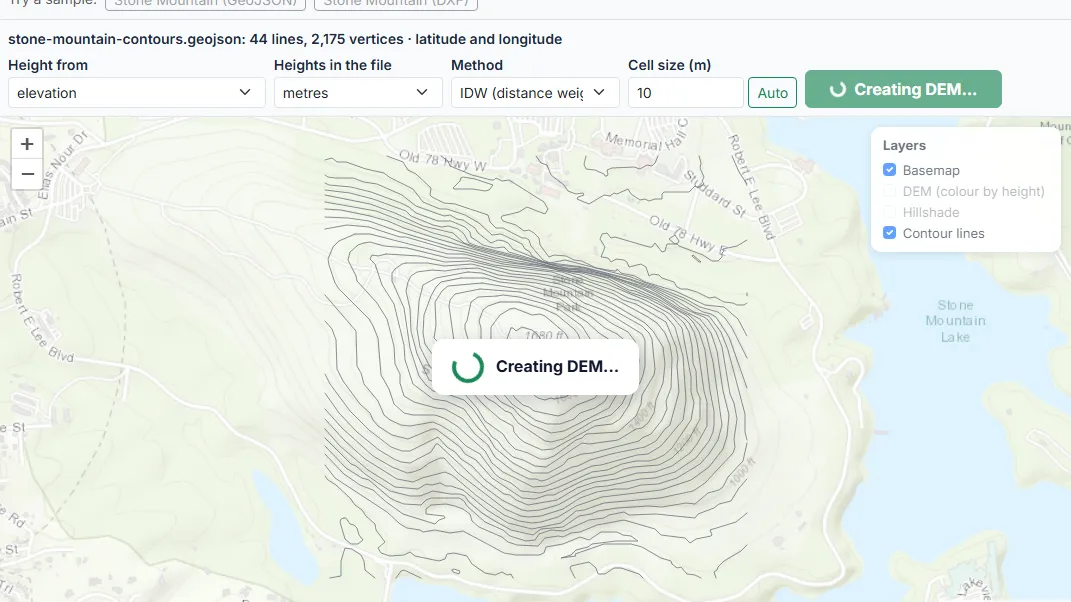
This contours to digital elevation model online tool needs one thing from you: a file of contour lines, each with its height. It reads the lines, puts points along them, joins all points into triangles (TIN) or weighs the nearest points (IDW), and works out a height for every cell of a regular grid. It then shades the grid, works out the figures and makes the downloads. Nothing is built until you press Generate DEM; a “Creating DEM” wheel then shows for about 10 seconds while the grid is made in a background worker, and the DEM appears on the map.
Free and Private: Your File Stays in Your Browser
Contours to DEM is free here: there is no account, email or payment, and no upload. If you looked for a contours to digital elevation model online free download, there is nothing to install either, because the tool runs in your browser. The file is opened in your browser, the DEM is built there, and the GeoTIFF, ASCII grid, PNG and PDF are made on your own device. This matters for survey and client data that should not leave your computer.
How to Use the Contours to DEM Converter
Uploading a File or Trying a Sample
Press Choose file or drop a file on the dashed box. The tool reads GeoJSON, KML, KMZ, zipped Shapefiles and DXF (see the table of formats below). To try it first, press one of the Stone Mountain samples: 44 contour lines at 10 m around Stone Mountain in Georgia, made with our Contour Map Generator, once as GeoJSON in latitude and longitude and once as DXF in local metres.
The Height Field and the Units
Each contour line needs a height. The tool looks for it in the attributes (names such as elevation, elev, height, contour, level, z or value come first), in the Z value of the vertices and, for DXF, in the elevation of each polyline or a number in its layer name. Only sources with at least two different values are offered. Choose the right one under Height from, and set Heights in the file to metres or feet. For DXF, also set the map units of the drawing. The m and ft buttons at the top choose the units of the results and the downloads.
Method and Cell Size
TIN (triangles) is the default and fits contour data best: every cell takes its height from the triangle of line points around it. IDW (distance weighted) takes the weighted mean of the 12 nearest points. The cell size is set to about 500 cells across the data and rounded to a common value; type your own to change it, or press Auto to go back. The grid is kept under 4 million cells for TIN and 1.5 million for IDW, so a phone can handle it. When the settings are ready, press Generate DEM. If you change a setting afterwards, the DEM on screen stays until you press Generate DEM again, and a note reminds you that it was made with the old settings.
Reading the Preview, the Figures and the Chart
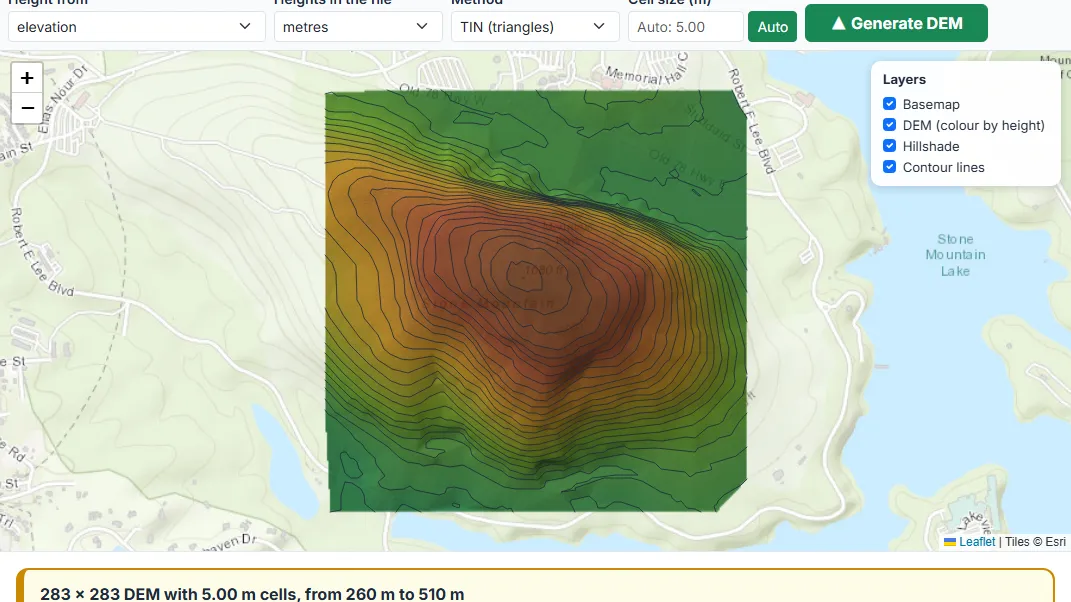
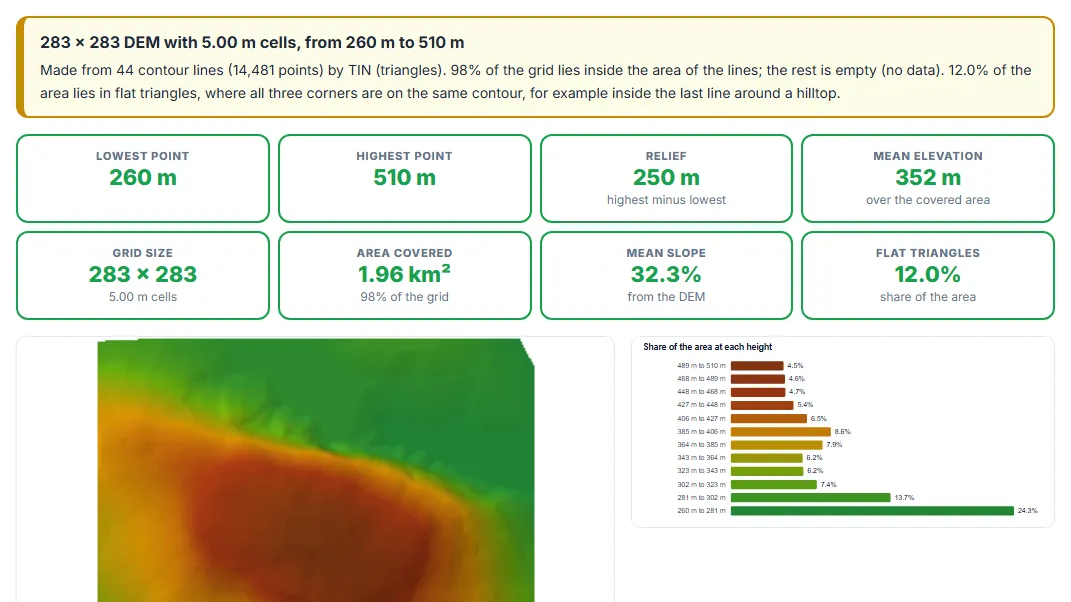
The DEM appears over the map, coloured from green (low) to brown (high) and shaded as if lit from the north-west, with your contour lines on top. The Layers box in the top-right corner of the map turns the basemap, the DEM colours, the hillshade and the contour lines on or off, so you can see the shading alone, the colours alone, or compare the grid with your lines. The yellow box gives the size of the grid and the height range; the cards give the lowest and highest point, the relief, the mean elevation, the grid, the area covered, the mean slope and the share of flat triangles (for IDW, the number of points used). The chart shows how much of the area lies at each height, and the Grid details table lists what a GIS user needs: cell size, extent, coordinate system and the no-data value (-9999).
Downloads and the PDF Report
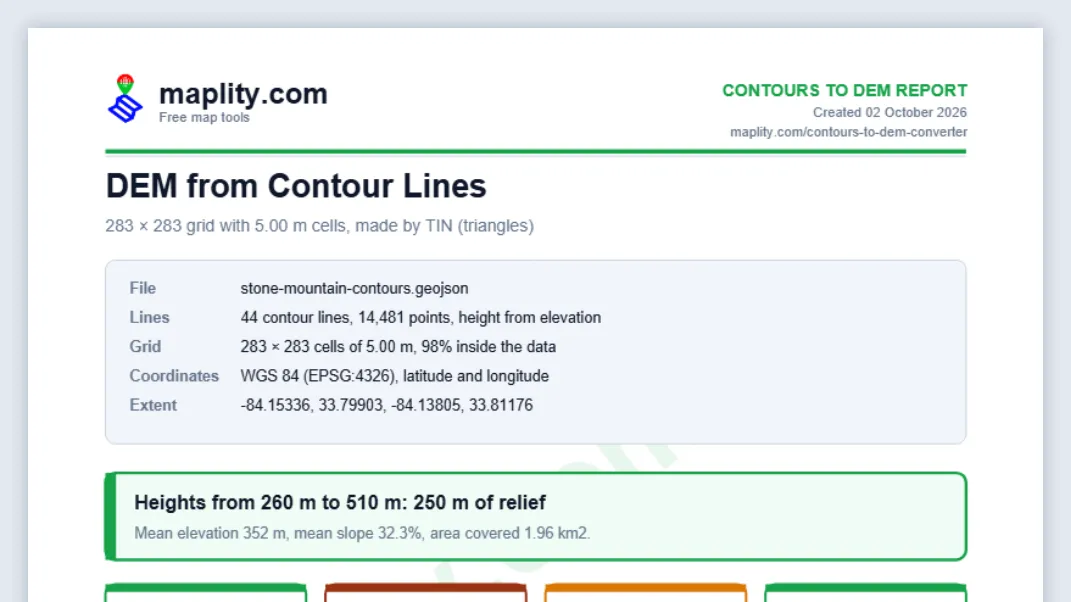
The GeoTIFF button gives a contours to DEM GeoTIFF download: one band of 32-bit floating point heights with its position, ready for QGIS, ArcGIS, Global Mapper and GDAL. ASCII Grid saves the same grid as plain text (Esri .asc), which almost any GIS and many CAD and modelling programs open. PNG heightmap saves a 16-bit grayscale image where black is the lowest point and white the highest; the height range is in the file name. Download PDF report saves a report with the maplity.com letterhead, the figures, the height chart, the DEM image with the lines and the method.
How to Convert Contours to a DEM: Step by Step
Press Choose file or drop a file on the box: GeoJSON, KML, KMZ, a zipped Shapefile (.zip with the .shp, .dbf and .prj) or DXF. The file is read in your browser and never uploaded. To see how it works first, press one of the Stone Mountain samples: the same contour lines as GeoJSON (latitude and longitude) and as DXF (local metres).
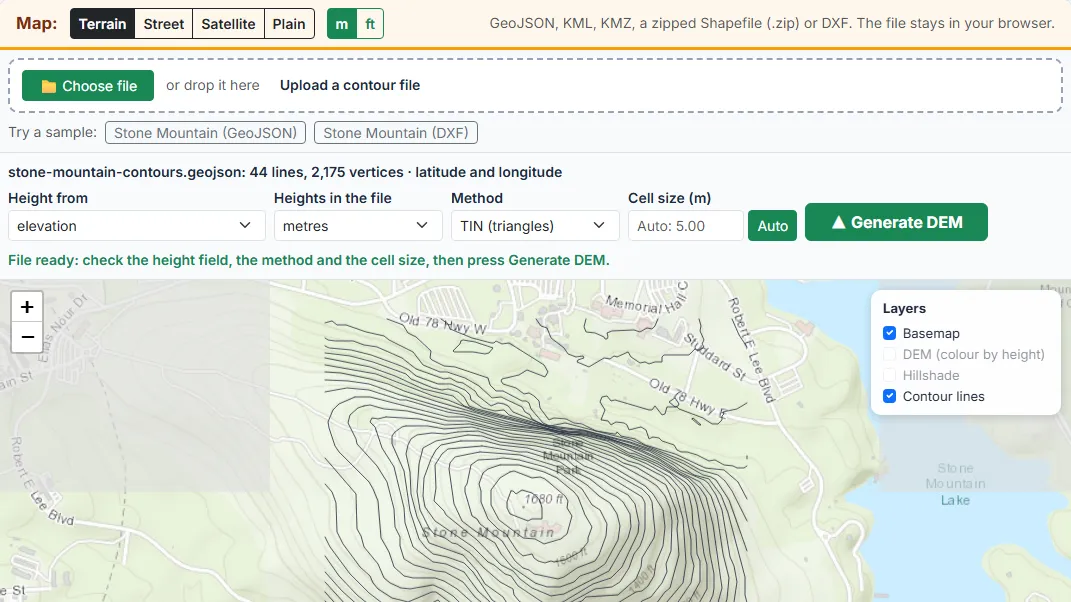
The tool finds the height of each line on its own: an attribute such as "elevation", "height" or "contour", or the Z value of the vertices. If the file has several numeric fields, pick the right one under Height from. Set whether the heights are in metres or feet, and for a DXF file whether the drawing units are metres or feet.
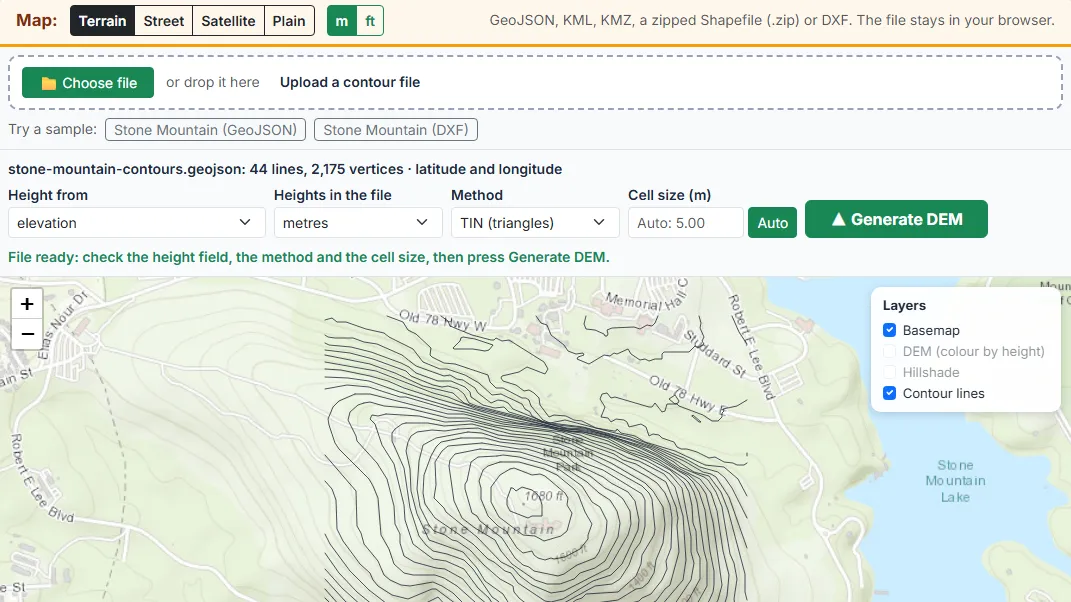
TIN joins the points on the lines into triangles and is the best choice for most contour data. IDW averages the nearest points and gives a softer surface. The cell size is set automatically to about 500 cells across the data; type a smaller value for more detail or a larger one for a lighter file. Then press Generate DEM: a Creating DEM wheel shows for about 10 seconds while the grid is made.
The DEM appears over the map in colour by height with hillshade, with your contour lines on top. Use the Layers box in the corner of the map to turn the basemap, the DEM colours, the hillshade and the contour lines on or off, and change the map style at the top. DXF and other files without a position on the Earth are shown on a plain grid instead of a world map.
The yellow box gives the grid size, the cell size and the height range. The cards show the lowest and highest point, the relief, the mean elevation, the grid, the area covered, the mean slope and the share of flat triangles. The chart shows how much of the area lies at each height, and the table lists the grid details for GIS work.
GeoTIFF saves the DEM as 32-bit floats with its position, for QGIS, ArcGIS and Global Mapper. ASCII Grid is a plain text grid that almost any GIS and many CAD programs read. PNG heightmap is a 16-bit grayscale image for Unity, Unreal and Blender. Download PDF report saves a report with the maplity.com letterhead, the figures, the chart and the DEM image.
How Contour Lines Become a DEM
TIN: Triangles Between the Lines
A TIN (triangulated irregular network) joins all points on the lines into triangles. The tool uses a Delaunay triangulation, which makes the triangles as even as possible: no point lies inside the circle through the three corners of any triangle. Inside each triangle the ground is a flat, sloping plane through its three corners, so a cell between a 100 m line and a 110 m line gets a height that changes evenly between them. Before triangulating, the tool adds points along long straight parts of the lines, about one cell apart, so the triangles follow the lines and do not cut across them.
IDW: Weighing the Nearest Points
IDW (inverse distance weighting) gives each cell the weighted mean of the 12 nearest points on the lines, with a weight of one over the distance squared. Near points count much more than far ones. The surface is smooth and has no triangle edges, but because all points on one line have the same height, IDW tends to make small steps along each line and rounded, bulging shapes between them.
TIN or IDW: Which to Choose
For the best contours to digital elevation model online result from contour lines, keep TIN: in the round trip of 200 places further down, TIN was closer to the true ground in 200 of them. The table compares the two on the same data.
| What | TIN | IDW |
|---|---|---|
| Typical error (median RMSE, share of the contour interval) | 18% | 29% |
| Ground within half an interval of the truth (mean) | 95.4% | 90.6% |
| Places where it was the closer of the two | 200 | 0 |
| Shape of the surface | Flat triangles, straight edges | Smooth, small steps along lines |
| Hilltops and valley floors | Flat inside the last line | Slightly rounded |
| Speed on large grids | Fast | Slower (grid limit 1.5 million cells) |
Choosing a Cell Size
The cell size sets how fine the grid is. A common rule for DEMs made from maps is a cell of about 0.5 mm at the map’s scale: finer cells do not add real detail, because the contours hold no information between the lines. The table gives this rule for common scales, with the contour interval such maps usually have.
| Map scale | Usual contour interval | Suggested cell size | Typical use |
|---|---|---|---|
| 1:1,000 | 0.5 m | 0.50 m | Building plot, garden |
| 1:2,500 | 1 m | 1.25 m | Site plan, small farm |
| 1:5,000 | 2 m | 2.50 m | Village, park, golf course |
| 1:10,000 | 5 m | 5 m | Town, valley, large estate |
| 1:25,000 | 10 m | 12.50 m | Hiking map, district |
| 1:50,000 | 20 m | 25 m | National topographic map |
| 1:100,000 | 50 m | 50 m | Region, overview map |
Halving the cell size makes the grid four times bigger. If your lines are far apart, a large cell gives the same surface in a much lighter file; if they are close together, as in a detailed site survey, a small cell keeps the shape of each line.
Known Artifacts and How to Spot Them
Flat triangles appear where all three corners of a triangle are on the same line: inside the last line around a hilltop, on valley floors and on wide terraces. The tool counts them and shows their share of the area. Straight edges run along triangle sides where the lines are far apart. Steps along the lines are typical of IDW. Near the outside of the data, triangles get long and thin, and cells beyond the outermost points are left empty. A spike or pit that stands out in the hillshade usually means one line has a wrong height.
Supported Files and What Is Read From Them
| Format | Lines read | Height from | Coordinates |
|---|---|---|---|
| GeoJSON (.geojson, .json) | LineString, MultiLineString, Polygon and MultiPolygon outlines | A numeric property, or the third coordinate (Z) | Latitude and longitude; projected numbers are kept as local units |
| KML (.kml) | LineString and polygon outlines in any folder | Altitude of the coordinates, or a number in ExtendedData | Latitude and longitude |
| KMZ (.kmz) | The KML inside the zip | As KML | Latitude and longitude |
| Shapefile (.zip) | Polyline and polygon shapes | A numeric field in the .dbf, or Z for PolylineZ | Moved to latitude and longitude with the .prj; kept as local units without it |
| DXF (.dxf) | LWPOLYLINE, POLYLINE (2D and 3D) and LINE | Elevation or Z, or a number in the layer name | The drawing’s own units (no position on the Earth) |
Points, text, splines, arcs and blocks are skipped. Up to 400 thousand points are used for the triangles; denser files are thinned evenly. Lines without a value in the chosen height field are left out, and the DEM needs at least two different heights.
10 Use Cases of a Contours to DEM Converter
Turning lines into a grid opens contour data to every raster tool. These are the most common uses.
1. Digitised paper maps
Many places only have contours from old topographic maps or survey plans. Once the lines are digitised with their heights, this tool turns them into a DEM that modern GIS tools can use for slope, hillshade and 3D views.
2. From CAD survey drawings to GIS
Surveyors and engineers often deliver contours in DXF. Converting them to a GeoTIFF or ASCII grid lets planners, landscape architects and GIS teams use the same ground model without CAD software.
3. Site design and earthworks
A DEM of a plot is the starting point for volume work: compare it with a design surface to estimate cut and fill, check drainage falls, and plan platforms, roads and retaining walls.
4. Flood and drainage studies
Flow direction, flow accumulation and flood extent models need a grid, not lines. A DEM made from local contours often has more detail than global elevation data in small, flat areas.
5. Hillshade and relief maps
A hillshade made from the DEM makes the shape of the land easy to see under a map. Designers and cartographers use it for posters, guide maps and reports.
6. 3D models and printing
The contours to DEM PNG heightmap (16-bit) goes straight into Blender, Unity or Unreal as a displacement map or terrain, and the GeoTIFF into tools that make 3D prints of the land.
7. Game levels and simulations
Game designers and simulation teams build real terrain from contours of a real place, then export the heightmap at the size their engine needs.
8. Solar and wind site checks
Slope and aspect from the DEM show which parts of a site face the sun and how much grading the panel rows need, and where turbines would sit on exposed ground.
9. Teaching GIS and geography
Students see how a few lines become a full surface, compare TIN and IDW, and learn why the result has flat tops and straight edges. The sample files make a ready classroom example.
10. Checking contour data
Building a DEM is a quick quality check: spikes, holes and stepped surfaces show lines with a wrong height, a missing height or a duplicate line.
The 10 Most Useful Things to Check on a DEM From Contours
These quick checks catch most problems before the DEM goes into a project.
- Make sure the right field is the height. If the preview looks like random stripes, a field such as an ID or a length was used. Choose the field with the contour heights under Height from.
- Check metres or feet. A DEM in feet read as metres is three times too steep. Compare the highest point with what you know of the place.
- Look at the share of flat triangles. A few percent is normal at hilltops and valley floors; a large share means the contour interval is wide for the shape of the land.
- Compare TIN and IDW. Switch the method, press Generate DEM again and compare: where they differ, the data between the lines is thin and the DEM is least certain.
- Pick a sensible cell size. Start with Auto, then use a smaller cell only if the lines are close together. Halving the cell makes the file four times bigger.
- Find lines with a wrong height. A sharp spike or pit in the hillshade often marks one line with a typing error in its height.
- See where the data ends. Cells outside the area of the lines are empty (no data). Make sure the area you need lies inside it.
- Check the position on the map. For GeoJSON, KML and Shapefiles the DEM should sit on the right place over the basemap. If it does not, the .prj may be missing.
- Read the slope figure. The mean slope helps to check the result against the ground: flat towns are a few percent, hilly ground 10 to 30%, mountains more.
- Keep a record. The PDF holds the figures, the height chart and the DEM image with the lines, which is useful for reports and project files.
The Mathematics Behind the Conversion
1. From Latitude and Longitude to a Flat Plane
Distances must be in metres, so lines in latitude and longitude are first moved to a flat plane around the centre of the data (φ0, λ0):
Over a few tens of kilometres this is accurate to well under 0.1%. DXF and other local files are used in their own units.
2. Delaunay Triangles and Barycentric Weights
The Delaunay triangulation joins the points so that no point lies inside the circumcircle of any triangle. For a cell centre P in the triangle with corners A, B and C, the barycentric weights say how close P is to each corner, and the height is their weighted sum:
wA = ((yB - yC)(xP - xC) + (xC - xB)(yP - yC)) / d wB = ((yC - yA)(xP - xC) + (xA - xC)(yP - yC)) / d wC = 1 - wA - wB
z(P) = wA × zA + wB × zB + wC × zC (P is inside when all weights are 0 or more)
3. Inverse Distance Weighting
IDW uses the 12 nearest points, found with a grid of buckets so not every point has to be tested:
4. Hillshade and Slope
The preview uses Horn’s method on each 3 × 3 block of cells (a b c / d e f / g h i), with the sun at 315° and 45° above the horizon:
slope = atan(√(dz/dx² + dz/dy²)) aspect = atan2(dz/dy, -dz/dx)
shade = 255 × (cos(zenith) × cos(slope) + sin(zenith) × sin(slope) × cos(azimuth - aspect))
The mean slope in the cards uses central differences on the grid, in percent, averaged over all covered cells.
5. Placing the Grid on the Earth
The GeoTIFF stores the top-left corner and the cell size. For latitude and longitude input the cells are square on the ground, so in degrees they are wider than tall:
The ASCII grid writes the same corner with GDAL’s dx and dy lines when the cells are not square in degrees.
File Formats, Libraries and Limits
The Downloads in Detail
The GeoTIFF is a single-band, uncompressed TIFF of 32-bit floats with the GeoTIFF tags for the pixel size, the tie point and the coordinate system (EPSG:4326, or none for local data) and a GDAL no-data value of -9999. The contours to DEM ASCII grid (.asc) follows the Esri format with an NODATA_value line. The PNG heightmap is a 16-bit grayscale PNG, scaled from the lowest height (0) to the highest (65,535); empty cells are black. All three are written by Maplity’s own code in your browser.
Software Libraries
The triangulation uses Delaunator with robust-predicates for exact geometry tests. Shapefiles are read by shpjs, which also reprojects them with proj4 using the .prj; KML is converted by @tmcw/togeojson and KMZ is unzipped by JSZip. The DXF reader, the gridding, the IDW search, the hillshade and the file writers are Maplity’s own code. The map is Leaflet 1.9 with Esri, CARTO and OpenStreetMap basemaps, the PDF is made by jsPDF, and the page runs on Next.js and React.
Limits
A DEM from contours knows only the heights on the lines. Features smaller than the contour interval, such as banks, ditches, kerbs and small mounds, are missing, and the ground between two lines is assumed to slope evenly. Very large files are thinned to 400 thousand points and the grid is kept under 4 million cells, so for a whole country use a desktop GIS. For construction, legal boundaries and flood design, use a land survey or national lidar data.
How Accurate Is a DEM From Contours? A Test on 200 Famous Places
How the Test Was Made
We took the same 200 famous places as on our Contour Map Generator and Elevation Profile Viewer pages. For each place, the heights of the 1 km² square came from AWS Terrain Tiles (zoom 15, light smoothing), and the Contour Map Generator’s own engine drew contour lines at its automatic interval. This converter then rebuilt a DEM from those lines alone, by TIN and by IDW, with one cell per terrain pixel, and every cell was compared with the true height. RMSE is the root mean square error in metres; within ½ interval is the share of the ground that came back within half a contour interval of the truth.
Over the 200 places with enough lines (9,755 contour lines in all), the typical TIN error was 18% of the contour interval and 95.4% of the ground came back within half an interval; for IDW the figures were 29% and 90.6%. TIN was the closer of the two in 200 places. Relative to the interval, the weakest results were at places by the water, such as Elbphilharmonie, Waikiki Beach, Giant's Causeway: there the square holds flat water surfaces and sea-floor depths with only a few lines far apart, so much of the ground lies between lines. The best were on steep, even mountain sides such as Matterhorn summit, where many close lines describe the shape well. The error grows with the interval, so rough ground with a 50 m interval has errors of several metres, while gentle ground at 1 or 2 m comes back within a few decimetres.
DEM From Contours: Results for 100 Famous Places in Europe
| # | Place | City, country | Relief | Interval | Lines | TIN error (RMSE) | TIN within ½ interval | IDW error (RMSE) | IDW within ½ interval |
|---|---|---|---|---|---|---|---|---|---|
| 1 | Big Ben (Elizabeth Tower) | London, United Kingdom | 11 m | 1 m | 185 | 0.32 m | 86.2% | 0.38 m | 77.6% |
| 2 | Tower of London | London, United Kingdom | 21 m | 1 m | 236 | 0.30 m | 86.7% | 0.40 m | 77.0% |
| 3 | Buckingham Palace | London, United Kingdom | 17 m | 1 m | 191 | 0.25 m | 93.5% | 0.32 m | 87.6% |
| 4 | Stonehenge | Amesbury, United Kingdom | 28 m | 2 m | 29 | 0.34 m | 96.3% | 0.58 m | 93.7% |
| 5 | Edinburgh Castle | Edinburgh, United Kingdom | 46 m | 5 m | 24 | 0.95 m | 96.5% | 1.45 m | 91.0% |
| 6 | Ben Nevis summit | Fort William, United Kingdom | 508 m | 25 m | 28 | 1.71 m | 99.9% | 6.06 m | 97.6% |
| 7 | Snowdon (Yr Wyddfa) summit | Llanberis, United Kingdom | 441 m | 25 m | 29 | 3.09 m | 97.7% | 6.44 m | 96.7% |
| 8 | Roman Baths | Bath, United Kingdom | 33 m | 2 m | 96 | 0.51 m | 93.0% | 0.69 m | 83.8% |
| 9 | Giant's Causeway | Bushmills, United Kingdom | 83 m | 5 m | 66 | 2.47 m | 58.7% | 2.83 m | 55.0% |
| 10 | Trinity College Dublin | Dublin, Ireland | 22 m | 1 m | 54 | 0.25 m | 92.7% | 0.33 m | 89.3% |
| 11 | Rock of Cashel | Cashel, Ireland | 62 m | 5 m | 16 | 0.80 m | 98.1% | 1.57 m | 89.8% |
| 12 | Carrauntoohil summit | Killarney, Ireland | 479 m | 25 m | 29 | 2.55 m | 99.4% | 6.34 m | 96.4% |
| 13 | Eiffel Tower | Paris, France | 44 m | 2 m | 80 | 0.43 m | 94.4% | 0.63 m | 88.8% |
| 14 | Louvre Museum | Paris, France | 33 m | 2 m | 130 | 0.46 m | 94.9% | 0.59 m | 91.6% |
| 15 | Notre-Dame de Paris | Paris, France | 35 m | 2 m | 168 | 0.46 m | 95.1% | 0.58 m | 91.7% |
| 16 | Sacré-Cœur Basilica, Montmartre | Paris, France | 67 m | 5 m | 20 | 0.54 m | 99.3% | 1.36 m | 95.4% |
| 17 | Palace of Versailles | Versailles, France | 40 m | 2 m | 44 | 0.24 m | 99.3% | 0.49 m | 96.2% |
| 18 | Mont-Saint-Michel Abbey | Le Mont-Saint-Michel, France | 61 m | 5 m | 46 | 0.46 m | 99.2% | 0.70 m | 97.7% |
| 19 | Mont Blanc summit | Chamonix, France | 608 m | 50 m | 24 | 6.79 m | 97.7% | 14.03 m | 95.6% |
| 20 | Aiguille du Midi | Chamonix, France | 817 m | 50 m | 19 | 4.77 m | 100.0% | 13.88 m | 95.2% |
| 21 | Pont du Gard | Vers-Pont-du-Gard, France | 87 m | 5 m | 32 | 0.89 m | 96.6% | 1.48 m | 90.8% |
| 22 | Cité de Carcassonne | Carcassonne, France | 58 m | 5 m | 16 | 1.06 m | 95.2% | 1.59 m | 89.1% |
| 23 | Palais des Papes | Avignon, France | 37 m | 2 m | 64 | 0.30 m | 98.0% | 0.53 m | 93.5% |
| 24 | Puy de Dôme summit | Clermont-Ferrand, France | 385 m | 20 m | 25 | 2.45 m | 98.1% | 5.06 m | 96.1% |
| 25 | Sagrada Família | Barcelona, Spain | 47 m | 5 m | 14 | 0.85 m | 98.1% | 1.64 m | 88.5% |
| 26 | Alhambra | Granada, Spain | 154 m | 10 m | 23 | 1.12 m | 99.5% | 2.57 m | 95.7% |
| 27 | Royal Palace of Madrid | Madrid, Spain | 89 m | 5 m | 27 | 0.76 m | 97.5% | 1.36 m | 94.1% |
| 28 | Seville Cathedral and Giralda | Seville, Spain | 26 m | 2 m | 53 | 0.41 m | 96.4% | 0.64 m | 88.6% |
| 29 | Mosque-Cathedral of Córdoba | Córdoba, Spain | 47 m | 5 m | 28 | 1.01 m | 94.8% | 1.67 m | 85.7% |
| 30 | Guggenheim Museum Bilbao | Bilbao, Spain | 123 m | 10 m | 24 | 1.90 m | 95.7% | 3.17 m | 87.9% |
| 31 | Santiago de Compostela Cathedral | Santiago de Compostela, Spain | 75 m | 5 m | 28 | 0.89 m | 96.2% | 1.40 m | 93.8% |
| 32 | Mount Teide summit | Tenerife, Spain | 380 m | 20 m | 21 | 1.15 m | 99.8% | 4.64 m | 98.4% |
| 33 | Montserrat Monastery | Monistrol de Montserrat, Spain | 648 m | 50 m | 20 | 5.07 m | 99.5% | 13.91 m | 95.7% |
| 34 | Belém Tower | Lisbon, Portugal | 23 m | 2 m | 24 | 0.26 m | 99.7% | 0.51 m | 94.2% |
| 35 | São Jorge Castle | Lisbon, Portugal | 90 m | 5 m | 35 | 0.61 m | 98.8% | 1.15 m | 96.5% |
| 36 | Porto Cathedral (Sé do Porto) | Porto, Portugal | 106 m | 5 m | 52 | 1.06 m | 94.6% | 1.47 m | 90.2% |
| 37 | Pena Palace | Sintra, Portugal | 180 m | 10 m | 43 | 1.14 m | 98.7% | 2.42 m | 96.8% |
| 38 | Colosseum | Rome, Italy | 41 m | 2 m | 61 | 0.29 m | 97.8% | 0.48 m | 95.8% |
| 39 | Trevi Fountain | Rome, Italy | 42 m | 2 m | 53 | 0.36 m | 96.4% | 0.53 m | 93.8% |
| 40 | Leaning Tower of Pisa | Pisa, Italy | 11 m | 1 m | 40 | 0.20 m | 94.4% | 0.30 m | 90.6% |
| 41 | Florence Cathedral (Duomo) | Florence, Italy | 31 m | 2 m | 45 | 0.36 m | 96.4% | 0.55 m | 92.8% |
| 42 | Piazzale Michelangelo | Florence, Italy | 93 m | 5 m | 28 | 1.11 m | 92.5% | 1.47 m | 90.3% |
| 43 | St Mark's Square | Venice, Italy | 15 m | 1 m | 98 | 0.15 m | 97.8% | 0.22 m | 96.0% |
| 44 | Milan Cathedral (Duomo di Milano) | Milan, Italy | 36 m | 2 m | 47 | 0.42 m | 95.1% | 0.60 m | 90.4% |
| 45 | Pompeii Forum | Pompei, Italy | 39 m | 2 m | 26 | 0.23 m | 99.4% | 0.52 m | 95.9% |
| 46 | Mount Vesuvius crater rim | Naples, Italy | 378 m | 20 m | 53 | 2.79 m | 98.2% | 4.85 m | 96.5% |
| 47 | Mount Etna summit area | Catania, Italy | 264 m | 20 m | 26 | 3.57 m | 96.4% | 5.88 m | 92.4% |
| 48 | Tre Cime di Lavaredo | Auronzo di Cadore, Italy | 557 m | 50 m | 16 | 5.83 m | 98.9% | 13.81 m | 95.6% |
| 49 | St Peter's Basilica | Vatican City, Vatican City | 55 m | 5 m | 24 | 0.84 m | 97.4% | 1.37 m | 93.7% |
| 50 | Brandenburg Gate | Berlin, Germany | 19 m | 1 m | 66 | 0.18 m | 96.7% | 0.26 m | 95.2% |
| 51 | Cologne Cathedral | Cologne, Germany | 27 m | 2 m | 22 | 0.43 m | 95.9% | 0.68 m | 86.7% |
| 52 | Neuschwanstein Castle | Schwangau, Germany | 404 m | 20 m | 24 | 1.72 m | 99.6% | 5.02 m | 96.5% |
| 53 | Marienplatz | Munich, Germany | 15 m | 1 m | 82 | 0.16 m | 97.6% | 0.25 m | 94.8% |
| 54 | Zugspitze summit | Garmisch-Partenkirchen, Germany | 710 m | 50 m | 35 | 6.34 m | 98.8% | 13.11 m | 96.5% |
| 55 | Heidelberg Castle | Heidelberg, Germany | 312 m | 20 m | 15 | 2.10 m | 99.5% | 5.66 m | 95.1% |
| 56 | Frauenkirche | Dresden, Germany | 23 m | 2 m | 34 | 0.51 m | 90.6% | 0.73 m | 84.2% |
| 57 | Elbphilharmonie | Hamburg, Germany | 14 m | 1 m | 50 | 0.63 m | 56.8% | 0.64 m | 55.8% |
| 58 | Brocken summit | Schierke (Harz), Germany | 129 m | 10 m | 21 | 0.50 m | 100.0% | 2.68 m | 98.2% |
| 59 | Matterhorn summit | Zermatt, Switzerland | 1,056 m | 50 m | 28 | 1.96 m | 100.0% | 11.55 m | 99.3% |
| 60 | Jungfraujoch | Grindelwald / Wengen, Switzerland | 635 m | 50 m | 18 | 9.68 m | 95.0% | 15.66 m | 90.3% |
| 61 | Chapel Bridge (Kapellbrücke) | Lucerne, Switzerland | 60 m | 5 m | 38 | 1.01 m | 95.0% | 1.37 m | 92.1% |
| 62 | Pilatus Kulm | Lucerne, Switzerland | 597 m | 50 m | 21 | 7.97 m | 97.0% | 14.88 m | 92.8% |
| 63 | Château de Chillon | Veytaux (Montreux), Switzerland | 318 m | 20 m | 16 | 1.96 m | 99.0% | 4.53 m | 98.8% |
| 64 | Schönbrunn Palace | Vienna, Austria | 53 m | 5 m | 27 | 1.11 m | 97.7% | 1.86 m | 78.7% |
| 65 | St Stephen's Cathedral | Vienna, Austria | 29 m | 2 m | 62 | 0.44 m | 96.5% | 0.67 m | 87.8% |
| 66 | Hohensalzburg Fortress | Salzburg, Austria | 129 m | 10 m | 30 | 2.71 m | 91.7% | 4.16 m | 71.8% |
| 67 | Hallstatt market square | Hallstatt, Austria | 501 m | 25 m | 25 | 2.27 m | 99.4% | 5.25 m | 98.9% |
| 68 | Grossglockner summit | Heiligenblut, Austria | 771 m | 50 m | 25 | 5.00 m | 99.7% | 13.14 m | 95.8% |
| 69 | Rijksmuseum | Amsterdam, Netherlands | 8 m | 1 m | 39 | 0.25 m | 91.9% | 0.33 m | 87.8% |
| 70 | Kinderdijk windmills | Kinderdijk, Netherlands | 6 m | 1 m | 20 | 0.38 m | 80.7% | 0.44 m | 76.0% |
| 71 | Vaalserberg (Three-Country Point) | Vaals, Netherlands | 80 m | 5 m | 39 | 0.63 m | 99.2% | 1.31 m | 96.0% |
| 72 | Grand-Place | Brussels, Belgium | 45 m | 5 m | 12 | 0.97 m | 96.0% | 1.71 m | 85.3% |
| 73 | Atomium | Brussels, Belgium | 40 m | 2 m | 32 | 0.36 m | 95.6% | 0.57 m | 92.7% |
| 74 | Belfry of Bruges | Bruges, Belgium | 8 m | 1 m | 27 | 0.19 m | 95.8% | 0.30 m | 91.6% |
| 75 | Acropolis of Athens (Parthenon) | Athens, Greece | 88 m | 5 m | 35 | 0.80 m | 97.4% | 1.33 m | 93.7% |
| 76 | Mount Olympus (Mytikas) | Litochoro, Greece | 537 m | 25 m | 41 | 2.47 m | 99.4% | 5.26 m | 98.4% |
| 77 | Meteora (Great Meteoron Monastery) | Kalambaka, Greece | 276 m | 20 m | 29 | 3.11 m | 97.4% | 5.55 m | 94.2% |
| 78 | Oia village | Santorini, Greece | 149 m | 10 m | 31 | 1.09 m | 99.1% | 2.35 m | 96.0% |
| 79 | Temple of Apollo, Delphi | Delphi, Greece | 580 m | 50 m | 14 | 3.99 m | 100.0% | 14.41 m | 94.7% |
| 80 | Prague Castle | Prague, Czechia | 78 m | 5 m | 22 | 0.66 m | 99.1% | 1.35 m | 94.4% |
| 81 | Český Krumlov Castle | Český Krumlov, Czechia | 70 m | 5 m | 37 | 1.11 m | 93.8% | 1.51 m | 89.9% |
| 82 | Wawel Royal Castle | Kraków, Poland | 33 m | 2 m | 43 | 0.40 m | 95.7% | 0.59 m | 90.1% |
| 83 | Old Town Market Place | Warsaw, Poland | 39 m | 2 m | 27 | 0.37 m | 97.6% | 0.56 m | 92.6% |
| 84 | Kasprowy Wierch | Zakopane, Poland | 345 m | 20 m | 55 | 2.20 m | 98.6% | 4.98 m | 97.1% |
| 85 | Hungarian Parliament Building | Budapest, Hungary | 34 m | 2 m | 74 | 0.44 m | 97.0% | 0.59 m | 92.2% |
| 86 | Fisherman's Bastion | Budapest, Hungary | 80 m | 5 m | 31 | 0.91 m | 96.2% | 1.46 m | 90.8% |
| 87 | Nyhavn | Copenhagen, Denmark | 15 m | 1 m | 111 | 0.20 m | 95.4% | 0.31 m | 91.5% |
| 88 | Stockholm Royal Palace | Stockholm, Sweden | 33 m | 2 m | 144 | 0.37 m | 96.9% | 0.64 m | 91.3% |
| 89 | Preikestolen (Pulpit Rock) | Stavanger region, Norway | 701 m | 50 m | 34 | 9.23 m | 97.9% | 16.71 m | 85.4% |
| 90 | Dubrovnik Old Town (Stradun) | Dubrovnik, Croatia | 212 m | 10 m | 42 | 1.35 m | 98.0% | 2.42 m | 95.1% |
| 91 | Plitvice Lakes (Veliki Slap) | Plitvička Jezera, Croatia | 141 m | 10 m | 24 | 1.62 m | 97.4% | 2.99 m | 90.2% |
| 92 | Bled Castle | Bled, Slovenia | 104 m | 5 m | 36 | 0.69 m | 98.1% | 1.07 m | 95.9% |
| 93 | Hagia Sophia | Istanbul, Türkiye | 58 m | 5 m | 26 | 0.72 m | 97.5% | 1.41 m | 92.7% |
| 94 | Casino de Monte-Carlo | Monte Carlo, Monaco | 188 m | 10 m | 64 | 0.67 m | 100.0% | 2.07 m | 98.3% |
| 95 | St John's Co-Cathedral | Valletta, Malta | 74 m | 5 m | 61 | 0.65 m | 98.7% | 1.14 m | 96.3% |
| 96 | Bran Castle | Bran, Romania | 203 m | 10 m | 35 | 1.80 m | 96.1% | 2.62 m | 93.8% |
| 97 | Rila Monastery | Rila, Bulgaria | 469 m | 25 m | 32 | 4.48 m | 95.3% | 7.15 m | 94.0% |
| 98 | Kotor Old Town | Kotor, Montenegro | 298 m | 20 m | 43 | 1.91 m | 100.0% | 4.65 m | 94.4% |
| 99 | Vaduz Castle | Vaduz, Liechtenstein | 408 m | 20 m | 21 | 1.60 m | 100.0% | 4.53 m | 98.4% |
| 100 | Guaita Tower | City of San Marino, San Marino | 292 m | 20 m | 21 | 1.74 m | 99.4% | 5.15 m | 97.5% |
DEM From Contours: Results for 100 Famous Places in the USA
| # | Place | City, country | Relief | Interval | Lines | TIN error (RMSE) | TIN within ½ interval | IDW error (RMSE) | IDW within ½ interval |
|---|---|---|---|---|---|---|---|---|---|
| 1 | Statue of Liberty | New York, NY, United States | 7 m | 1 m | 19 | 0.24 m | 93.3% | 0.38 m | 83.9% |
| 2 | Empire State Building | New York, NY, United States | 16 m | 1 m | 21 | 0.11 m | 99.4% | 0.27 m | 97.0% |
| 3 | Belvedere Castle, Central Park | New York, NY, United States | 28 m | 2 m | 40 | 0.47 m | 93.3% | 0.68 m | 84.2% |
| 4 | One World Trade Center | New York, NY, United States | 30 m | 2 m | 165 | 0.54 m | 90.8% | 0.72 m | 83.7% |
| 5 | Niagara Falls (Terrapin Point) | Niagara Falls, NY, United States | 121 m | 10 m | 68 | 3.69 m | 79.4% | 4.08 m | 75.7% |
| 6 | Mount Marcy summit | Keene, NY, United States | 313 m | 20 m | 27 | 1.20 m | 100.0% | 4.97 m | 97.9% |
| 7 | United States Capitol | Washington, DC, United States | 33 m | 2 m | 88 | 0.48 m | 94.3% | 0.67 m | 87.9% |
| 8 | Lincoln Memorial | Washington, DC, United States | 29 m | 2 m | 90 | 0.68 m | 84.5% | 0.91 m | 72.5% |
| 9 | The White House | Washington, DC, United States | 21 m | 1 m | 115 | 0.21 m | 95.7% | 0.31 m | 89.3% |
| 10 | Arlington National Cemetery | Arlington, VA, United States | 58 m | 5 m | 31 | 0.94 m | 96.8% | 1.56 m | 90.3% |
| 11 | Mount Vernon | Mount Vernon, VA, United States | 17 m | 1 m | 163 | 0.24 m | 94.1% | 0.30 m | 89.0% |
| 12 | Fort McHenry | Baltimore, MD, United States | 12 m | 1 m | 45 | 0.38 m | 76.6% | 0.46 m | 71.9% |
| 13 | Independence Hall | Philadelphia, PA, United States | 13 m | 1 m | 149 | 0.25 m | 93.2% | 0.33 m | 86.3% |
| 14 | Little Round Top, Gettysburg | Gettysburg, PA, United States | 68 m | 5 m | 37 | 0.79 m | 98.8% | 1.38 m | 93.2% |
| 15 | Fallingwater | Mill Run, PA, United States | 182 m | 10 m | 31 | 1.80 m | 95.9% | 2.83 m | 93.1% |
| 16 | Boston Common | Boston, MA, United States | 28 m | 2 m | 20 | 0.52 m | 87.5% | 0.68 m | 84.5% |
| 17 | Fenway Park | Boston, MA, United States | 9 m | 1 m | 32 | 0.18 m | 98.5% | 0.28 m | 95.2% |
| 18 | Cadillac Mountain summit | Bar Harbor, ME, United States | 221 m | 20 m | 21 | 2.40 m | 99.7% | 5.79 m | 93.0% |
| 19 | Mount Washington summit | Sargent’s Purchase, NH, United States | 312 m | 20 m | 22 | 2.12 m | 98.8% | 5.42 m | 96.0% |
| 20 | Mount Mitchell summit | Burnsville, NC, United States | 282 m | 20 m | 33 | 2.35 m | 98.4% | 4.93 m | 97.6% |
| 21 | Biltmore Estate | Asheville, NC, United States | 115 m | 10 m | 25 | 2.10 m | 94.6% | 2.93 m | 91.0% |
| 22 | Wright Brothers National Memorial | Kill Devil Hills, NC, United States | 26 m | 2 m | 60 | 0.49 m | 96.1% | 0.70 m | 83.4% |
| 23 | Clingmans Dome | Great Smoky Mountains, TN, United States | 380 m | 20 m | 38 | 2.13 m | 99.0% | 4.66 m | 97.7% |
| 24 | Graceland | Memphis, TN, United States | 17 m | 1 m | 126 | 0.19 m | 97.2% | 0.29 m | 90.3% |
| 25 | The Parthenon, Centennial Park | Nashville, TN, United States | 49 m | 5 m | 24 | 0.90 m | 98.2% | 1.66 m | 86.9% |
| 26 | Stone Mountain summit | Stone Mountain, GA, United States | 248 m | 20 m | 21 | 2.32 m | 98.6% | 5.06 m | 96.8% |
| 27 | Centennial Olympic Park | Atlanta, GA, United States | 43 m | 2 m | 70 | 0.38 m | 96.5% | 0.59 m | 91.8% |
| 28 | Forsyth Park | Savannah, GA, United States | 23 m | 2 m | 50 | 0.49 m | 93.3% | 0.71 m | 83.6% |
| 29 | Vehicle Assembly Building, Kennedy Space Center | Merritt Island, FL, United States | 15 m | 1 m | 159 | 0.33 m | 84.2% | 0.37 m | 80.0% |
| 30 | Cinderella Castle, Magic Kingdom | Bay Lake, FL, United States | 3 m | 1 m | 2 | 0.23 m | 94.6% | 0.29 m | 93.8% |
| 31 | Shark Valley, Everglades National Park | Miami-Dade County, FL, United States | 3 m | 1 m | 9 | 0.19 m | 96.8% | 0.31 m | 84.3% |
| 32 | South Beach (Ocean Drive) | Miami Beach, FL, United States | 4 m | 1 m | 133 | 0.23 m | 97.7% | 0.27 m | 94.3% |
| 33 | Southernmost Point Buoy | Key West, FL, United States | 22 m | 1 m | 93 | 0.20 m | 95.8% | 0.29 m | 91.2% |
| 34 | Castillo de San Marcos | St. Augustine, FL, United States | 4 m | 1 m | 101 | 0.36 m | 83.6% | 0.44 m | 77.5% |
| 35 | U.S. Space & Rocket Center | Huntsville, AL, United States | 65 m | 5 m | 16 | 1.30 m | 91.3% | 1.77 m | 84.8% |
| 36 | Jackson Square, French Quarter | New Orleans, LA, United States | 6 m | 1 m | 87 | 0.30 m | 86.6% | 0.40 m | 76.3% |
| 37 | Bathhouse Row, Hot Springs | Hot Springs, AR, United States | 123 m | 10 m | 29 | 2.36 m | 92.8% | 2.94 m | 90.6% |
| 38 | Churchill Downs | Louisville, KY, United States | 8 m | 1 m | 120 | 0.26 m | 93.5% | 0.33 m | 86.1% |
| 39 | Mammoth Cave Visitor Center | Mammoth Cave, KY, United States | 99 m | 5 m | 64 | 1.01 m | 95.2% | 1.37 m | 91.5% |
| 40 | Rock and Roll Hall of Fame | Cleveland, OH, United States | 26 m | 2 m | 80 | 0.65 m | 89.2% | 0.85 m | 79.0% |
| 41 | Renaissance Center | Detroit, MI, United States | 11 m | 1 m | 114 | 0.27 m | 91.5% | 0.37 m | 82.5% |
| 42 | Indianapolis Motor Speedway | Speedway, IN, United States | 7 m | 1 m | 162 | 0.30 m | 89.3% | 0.40 m | 77.8% |
| 43 | Willis Tower | Chicago, IL, United States | 8 m | 1 m | 28 | 0.27 m | 89.9% | 0.33 m | 86.6% |
| 44 | Cloud Gate, Millennium Park | Chicago, IL, United States | 9 m | 1 m | 38 | 0.32 m | 85.6% | 0.37 m | 82.5% |
| 45 | Wisconsin State Capitol | Madison, WI, United States | 26 m | 2 m | 62 | 0.38 m | 96.1% | 0.59 m | 91.1% |
| 46 | Minnehaha Falls | Minneapolis, MN, United States | 43 m | 2 m | 73 | 0.54 m | 91.8% | 0.74 m | 82.6% |
| 47 | Gateway Arch | St. Louis, MO, United States | 30 m | 2 m | 71 | 0.86 m | 69.6% | 0.96 m | 64.6% |
| 48 | Mount Rushmore | Keystone, SD, United States | 246 m | 20 m | 42 | 4.38 m | 94.8% | 5.92 m | 91.1% |
| 49 | Devils Tower | Crook County, WY, United States | 379 m | 20 m | 31 | 2.51 m | 99.8% | 5.73 m | 93.0% |
| 50 | Old Faithful, Yellowstone | Yellowstone National Park, WY, United States | 102 m | 5 m | 39 | 0.75 m | 99.6% | 1.31 m | 96.3% |
| 51 | Grand Teton summit | Jackson, WY, United States | 994 m | 50 m | 49 | 7.01 m | 98.7% | 12.96 m | 95.5% |
| 52 | Chimney Rock | Bayard, NE, United States | 129 m | 10 m | 25 | 1.38 m | 98.9% | 2.85 m | 93.3% |
| 53 | Colorado State Capitol | Denver, CO, United States | 25 m | 2 m | 64 | 0.47 m | 95.2% | 0.71 m | 84.0% |
| 54 | Red Rocks Amphitheatre | Morrison, CO, United States | 276 m | 20 m | 47 | 3.34 m | 98.2% | 5.65 m | 92.5% |
| 55 | Pikes Peak summit | Colorado Springs, CO, United States | 453 m | 25 m | 34 | 2.70 m | 99.5% | 6.34 m | 95.8% |
| 56 | Mount Elbert summit | Leadville, CO, United States | 478 m | 25 m | 30 | 2.48 m | 98.8% | 6.18 m | 98.2% |
| 57 | Garden of the Gods | Colorado Springs, CO, United States | 78 m | 5 m | 31 | 0.63 m | 99.1% | 1.40 m | 93.2% |
| 58 | Cliff Palace, Mesa Verde | Montezuma County, CO, United States | 153 m | 10 m | 29 | 2.80 m | 89.7% | 3.80 m | 77.3% |
| 59 | Delicate Arch, Arches National Park | Moab, UT, United States | 168 m | 10 m | 68 | 1.96 m | 96.9% | 2.83 m | 92.2% |
| 60 | Angels Landing, Zion National Park | Springdale, UT, United States | 486 m | 25 m | 66 | 5.98 m | 93.1% | 7.93 m | 89.1% |
| 61 | Sunset Point, Bryce Canyon | Bryce Canyon City, UT, United States | 212 m | 10 m | 74 | 1.97 m | 96.0% | 2.82 m | 91.1% |
| 62 | Temple Square | Salt Lake City, UT, United States | 68 m | 5 m | 37 | 0.83 m | 98.5% | 1.55 m | 89.8% |
| 63 | Mather Point, Grand Canyon South Rim | Grand Canyon Village, AZ, United States | 920 m | 50 m | 22 | 12.20 m | 99.5% | 15.46 m | 95.5% |
| 64 | Horseshoe Bend overlook | Page, AZ, United States | 393 m | 20 m | 24 | 3.42 m | 97.1% | 6.18 m | 88.9% |
| 65 | Cathedral Rock | Sedona, AZ, United States | 309 m | 20 m | 28 | 2.87 m | 99.1% | 5.28 m | 94.5% |
| 66 | Monument Valley (The Mittens view) | Oljato-Monument Valley, AZ, United States | 112 m | 10 m | 17 | 1.92 m | 96.4% | 3.31 m | 86.1% |
| 67 | Meteor Crater rim | Winslow, AZ, United States | 187 m | 10 m | 50 | 1.96 m | 94.4% | 2.58 m | 92.2% |
| 68 | Hoover Dam | Boulder City, NV, United States | 294 m | 20 m | 36 | 5.23 m | 87.7% | 6.68 m | 82.2% |
| 69 | Bellagio Fountains, Las Vegas Strip | Paradise, NV, United States | 17 m | 1 m | 35 | 0.11 m | 99.7% | 0.26 m | 97.2% |
| 70 | Carlsbad Caverns Visitor Center | Carlsbad, NM, United States | 95 m | 5 m | 68 | 1.26 m | 90.6% | 1.52 m | 88.6% |
| 71 | White Sands dune field | Alamogordo, NM, United States | 10 m | 1 m | 10 | 0.05 m | 100.0% | 0.29 m | 96.2% |
| 72 | Santa Fe Plaza | Santa Fe, NM, United States | 52 m | 5 m | 12 | 0.52 m | 99.4% | 1.40 m | 95.0% |
| 73 | Taos Pueblo | Taos, NM, United States | 26 m | 2 m | 15 | 0.15 m | 99.9% | 0.56 m | 96.4% |
| 74 | The Alamo | San Antonio, TX, United States | 19 m | 1 m | 98 | 0.25 m | 93.1% | 0.35 m | 85.0% |
| 75 | Texas State Capitol | Austin, TX, United States | 29 m | 2 m | 40 | 0.33 m | 96.6% | 0.53 m | 94.4% |
| 76 | Space Center Houston | Houston, TX, United States | 10 m | 1 m | 181 | 0.31 m | 88.3% | 0.37 m | 82.3% |
| 77 | Guadalupe Peak summit | Culberson County, TX, United States | 763 m | 50 m | 29 | 6.33 m | 98.8% | 13.49 m | 96.4% |
| 78 | Chisos Basin, Big Bend | Big Bend National Park, TX, United States | 239 m | 20 m | 22 | 3.46 m | 97.8% | 6.09 m | 90.4% |
| 79 | Badwater Basin, Death Valley | Inyo County, CA, United States | 325 m | 20 m | 43 | 2.34 m | 99.2% | 4.51 m | 95.7% |
| 80 | Mount Whitney summit | Lone Pine, CA, United States | 647 m | 50 m | 19 | 6.62 m | 99.2% | 12.83 m | 96.1% |
| 81 | Half Dome summit, Yosemite | Yosemite National Park, CA, United States | 986 m | 50 m | 31 | 6.98 m | 97.5% | 13.68 m | 94.9% |
| 82 | Tunnel View, Yosemite | Yosemite National Park, CA, United States | 510 m | 25 m | 28 | 2.48 m | 100.0% | 6.32 m | 96.9% |
| 83 | Golden Gate Bridge (south end) | San Francisco, CA, United States | 125 m | 10 m | 23 | 1.50 m | 99.5% | 3.15 m | 89.2% |
| 84 | Alcatraz Island | San Francisco, CA, United States | 84 m | 5 m | 41 | 0.96 m | 96.7% | 1.48 m | 91.1% |
| 85 | Hollywood Sign | Los Angeles, CA, United States | 278 m | 20 m | 38 | 3.13 m | 97.9% | 4.84 m | 96.1% |
| 86 | Santa Monica Pier | Santa Monica, CA, United States | 24 m | 2 m | 51 | 0.45 m | 94.4% | 0.72 m | 86.9% |
| 87 | Balboa Park | San Diego, CA, United States | 54 m | 5 m | 42 | 1.20 m | 93.6% | 1.61 m | 85.6% |
| 88 | Emerald Bay, Lake Tahoe | South Lake Tahoe, CA, United States | 443 m | 25 m | 26 | 3.47 m | 98.5% | 6.83 m | 93.4% |
| 89 | General Sherman Tree, Sequoia | Sequoia National Park, CA, United States | 268 m | 20 m | 19 | 1.95 m | 99.5% | 5.53 m | 95.8% |
| 90 | Rim Village, Crater Lake | Crater Lake National Park, OR, United States | 477 m | 25 m | 29 | 4.90 m | 95.3% | 7.21 m | 91.8% |
| 91 | Mount Hood summit | Government Camp, OR, United States | 682 m | 50 m | 28 | 5.81 m | 99.3% | 13.42 m | 96.5% |
| 92 | Multnomah Falls | Columbia River Gorge, OR, United States | 539 m | 25 m | 28 | 3.76 m | 97.8% | 6.16 m | 96.1% |
| 93 | Space Needle | Seattle, WA, United States | 43 m | 2 m | 69 | 0.38 m | 96.4% | 0.63 m | 89.4% |
| 94 | Mount Rainier summit | Pierce County, WA, United States | 313 m | 20 m | 35 | 1.97 m | 99.7% | 5.25 m | 96.6% |
| 95 | Johnston Ridge, Mount St. Helens | Skamania County, WA, United States | 311 m | 20 m | 38 | 2.83 m | 98.5% | 5.38 m | 94.0% |
| 96 | Logan Pass, Glacier National Park | Glacier National Park, MT, United States | 541 m | 25 m | 32 | 1.88 m | 99.8% | 6.30 m | 98.2% |
| 97 | Mauna Kea summit | Hawaiʻi Island, HI, United States | 258 m | 20 m | 23 | 3.16 m | 97.3% | 5.29 m | 95.4% |
| 98 | Diamond Head crater (Lēʻahi) | Honolulu, HI, United States | 170 m | 10 m | 64 | 1.34 m | 98.6% | 1.62 m | 98.2% |
| 99 | Waikiki Beach | Honolulu, HI, United States | 19 m | 1 m | 80 | 0.50 m | 75.3% | 0.69 m | 72.8% |
| 100 | Haleakalā summit | Maui, HI, United States | 168 m | 10 m | 42 | 1.06 m | 98.9% | 2.35 m | 97.1% |