Contour Map Generator: See the Shape of the Land
What a Contour Map Shows
A contour line joins points of equal height. Draw them at a fixed step, the contour interval, and a flat map starts to show hills and valleys. Close lines mean a steep slope, wide gaps mean gentle ground, and closed loops mark hilltops or hollows. Every topographic map, from hiking maps to building plans, uses them.
What This Contour Map Tool Does
This contour map creator needs only two choices from you: a centre point and a square of 1 to 5 km² around it. The tool loads the terrain tiles that cover the square, turns their colours into heights, cleans and smooths them, and traces a contour line at every level of your interval. About 12 seconds later the lines appear on the map, and they are made again each time you change the centre, the area, the interval, the units or the smoothing. Everything is computed in your browser.
Free to Use and Free to Download, With No Sign-Up
You can use this contour map generator free online, and every file is a free download: there is no account, email or payment. The terrain tiles come straight from a public dataset, the contours and the PDF are made on your device, and a share link holds only the centre, the area and your settings. If you searched for a contour map generator free download, there is nothing to install: the tool runs in your browser on any computer or phone.
How to Use the Contour Map Generator
Choosing the Place and the Area
Click the map to set the centre of the area, search for a town, an address or a mountain, press My location, or load one of the examples. A red dot marks the centre and a dashed square shows the area that will be mapped. Drag the red dot to move the area. The Area slider sets the size from 1 km² (1 × 1 km, the default) to 5 km² (about 2.24 × 2.24 km) in steps of 0.5 km²: use 1 km² for a plot or a village and the larger squares for a whole hill or valley.
Setting the Contour Interval
Type any interval in the Contour interval box, press one of the preset buttons below it, or press Auto. Auto divides the relief of the area by 22 and rounds up to the next common interval, which gives up to 22 levels (see the tables below). The m and ft buttons switch all heights, the interval and the downloads between metres and feet. If an interval would draw more than 250 levels, the tool doubles it until the map stays readable, and says so.
Smoothing, Colour Fill and Labels
Smoothing calms small bumps in the data: Light is the default, Strong gives round lines for presentations, and Off keeps every detail. Colour fill tints the square from green (low) to brown (high), and Height labels writes the height on the index contours. Hover over any line to see its height. The map styles are Terrain, Street, Satellite and Plain; Plain shows the contours alone on a light background.
Reading the Figures, the Drawing and the Chart
The yellow box describes the ground in words (flat, gently rolling, hilly, steep hills or mountainous), with its relief. The cards give the centre elevation, the lowest and the highest point, the relief, the mean elevation over the area, the mean slope with the share of the area steeper than 30%, the steepest slope and the number and length of the lines. The contour drawing shows the same lines on a white page with a north arrow, a scale bar and a height legend, and the bar chart shows how much of the area lies at each height. The Contour levels table lists every level.
Downloads, Sharing and the PDF Report
If you need a contour map generator with GeoJSON output, GeoJSON saves the lines in latitude and longitude with their height, for QGIS, ArcGIS and web maps. KML opens in Google Earth. For CAD users, this is a free contour map generator online with a CAD export: DXF (CAD) saves 3D polylines on the layers CONTOUR and INDEX, in metres (or feet) east and north of the centre, with the height as Z. Copy share link copies a link that opens the same place and settings, and Download PDF report saves a report with the maplity.com letterhead and watermark, the figures, the height chart, the contour drawing, the levels table and the method.
How to Use the Contour Map Creator: Step by Step
Click anywhere on the map to set the centre of the area, or type a town, an address or a mountain and press Search. My location uses your current position, and the Try buttons load well-known places such as the Vesuvius crater or Stone Mountain. A red dot marks the centre and a dashed square shows the area.
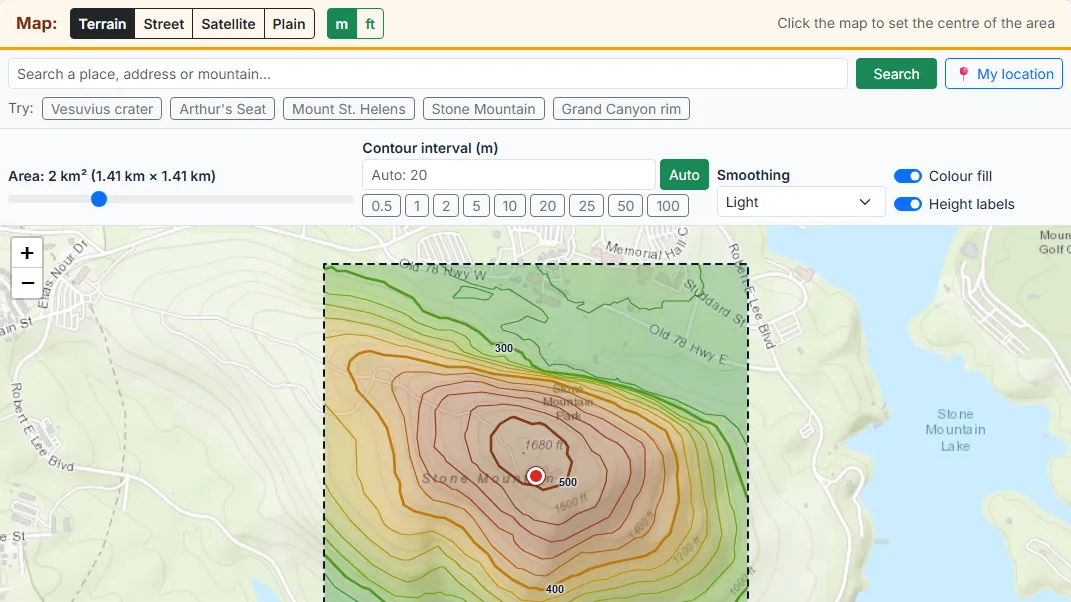
Move the Area slider to choose a square of 1 to 5 km² around the centre, from 1 × 1 km up to about 2.24 × 2.24 km. Type a contour interval, press one of the preset buttons, or leave it on Auto, which picks a round interval that gives up to 22 levels across the area. Switch between metres and feet at the top.
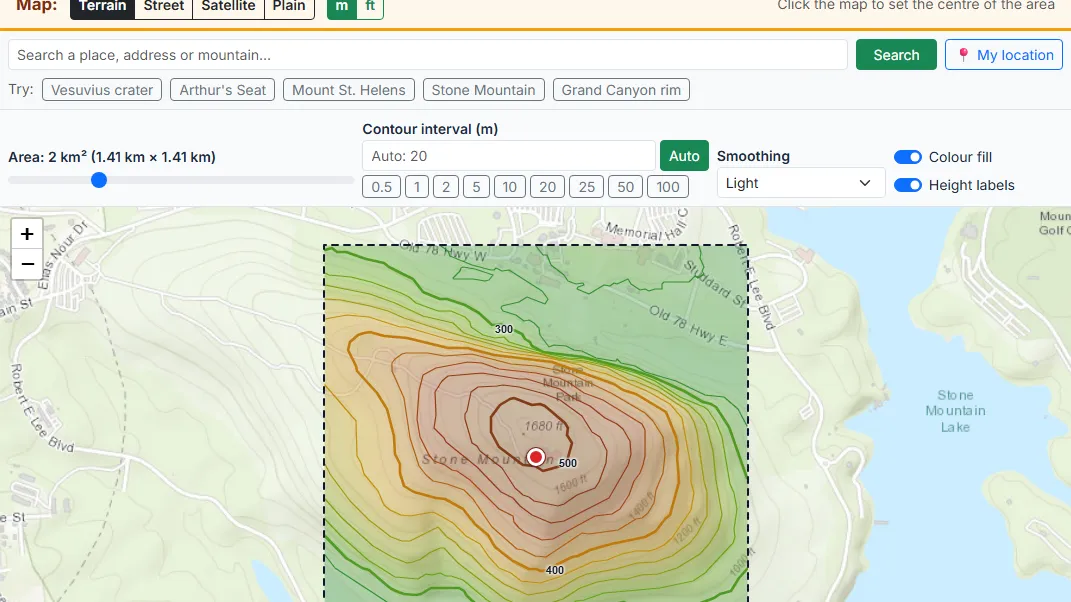
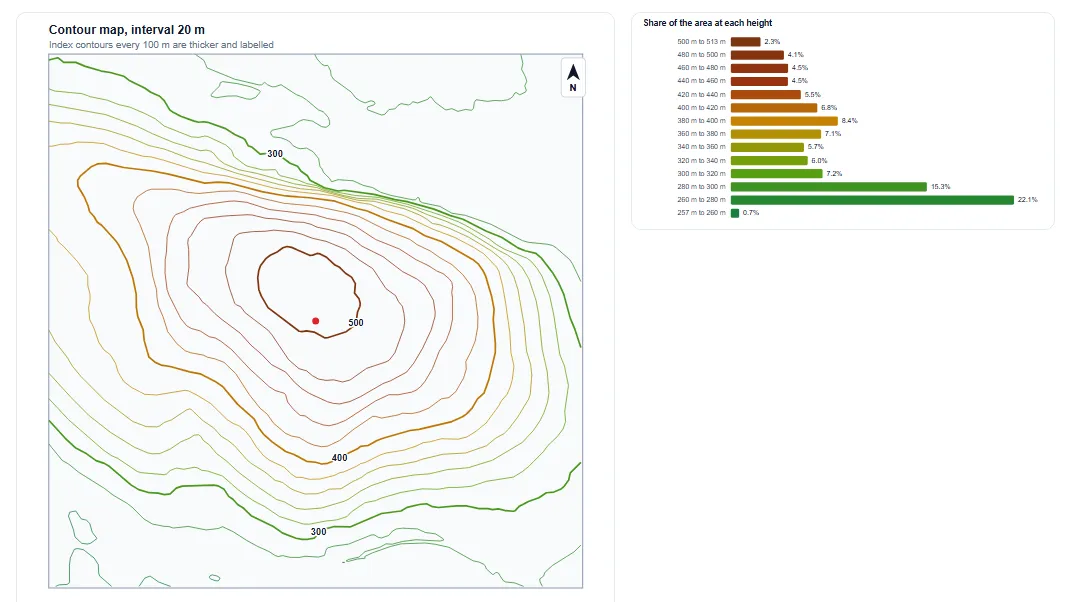
The lines are coloured from green (low) to brown (high), and every 5th line is a thicker index contour with its height written on it. Hover over any line to see its height. Turn the colour fill and the labels on or off, choose the smoothing, and drag the red centre to move the area.
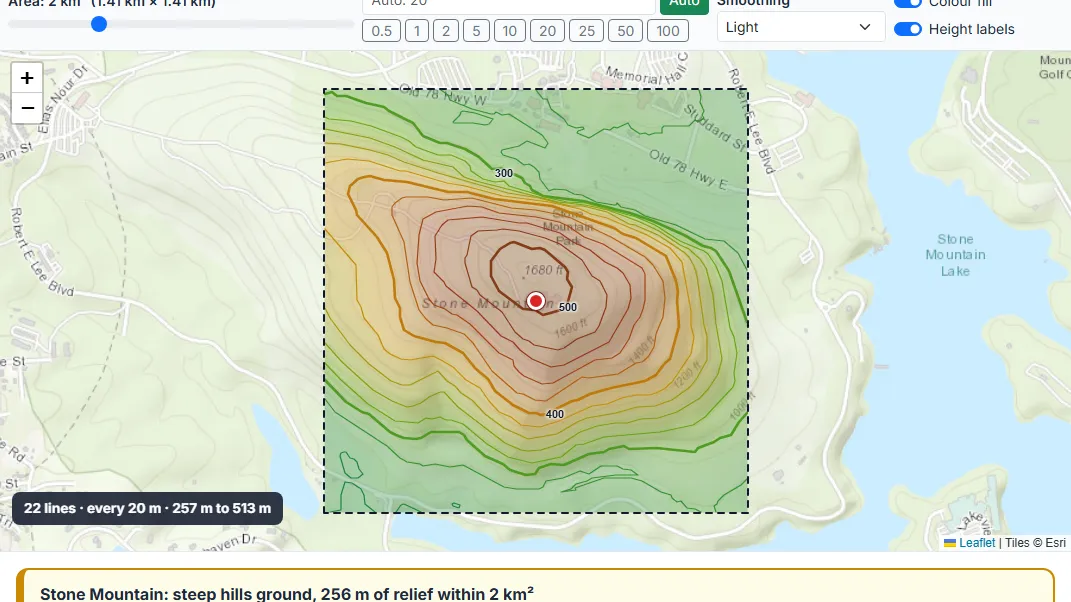
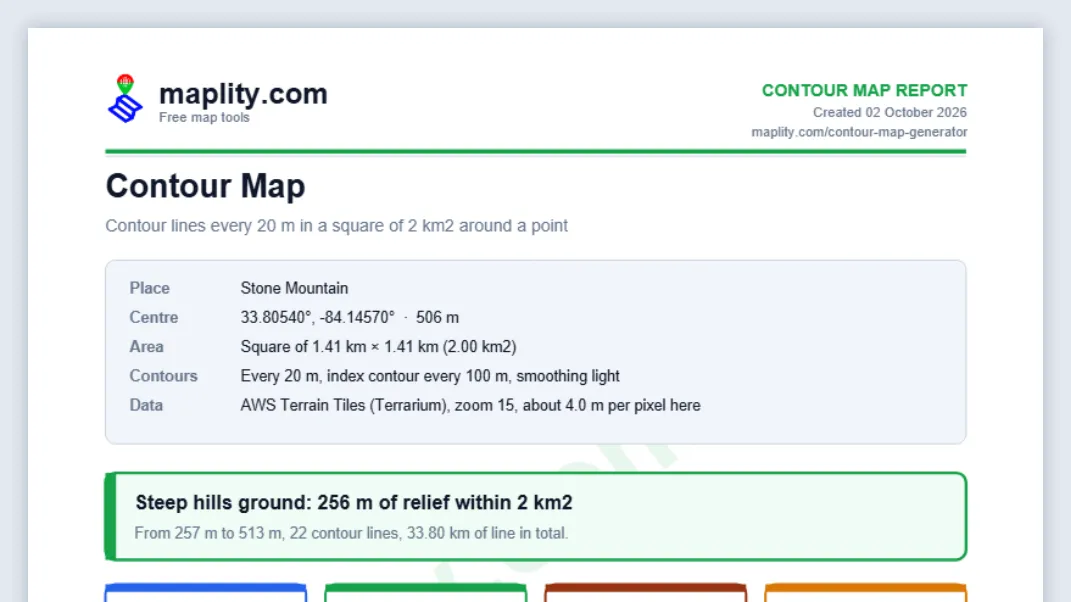
The yellow box describes the ground in words, from flat to mountainous, with its relief. The cards give the centre elevation, the lowest and highest point, the relief, the mean elevation, the mean and the steepest slope, and the number and total length of the contour lines.
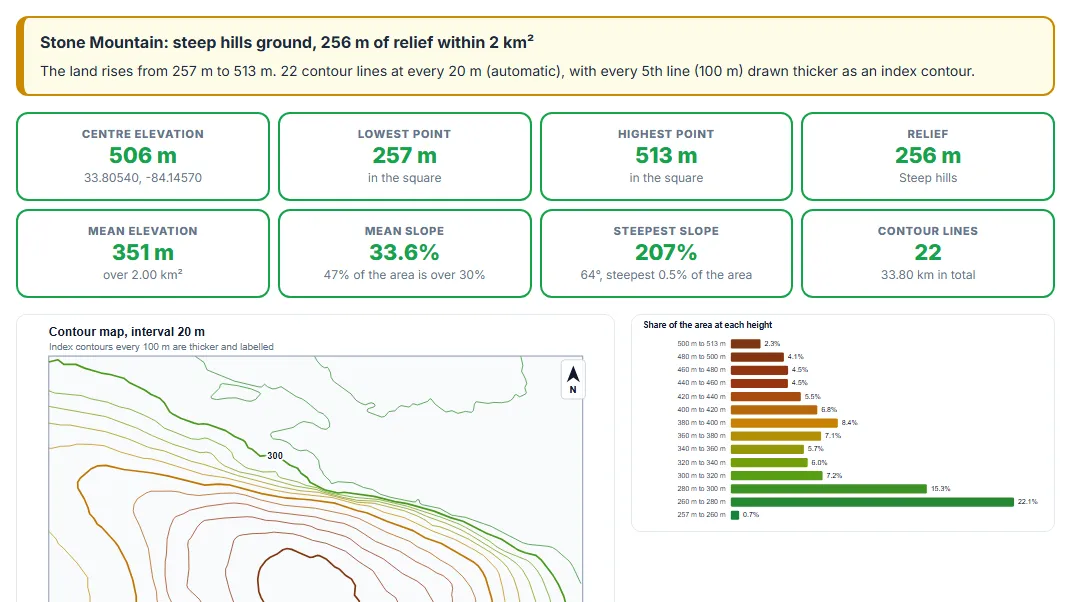
Below the figures, a clean contour drawing shows the square with its lines, labels, north arrow, scale bar and colour legend, ready for a report. Next to it, a bar chart shows how much of the area lies at each height. The Contour levels table lists every level with its number of lines and total length.
Download the lines as GeoJSON, KML (for Google Earth) or DXF (for CAD, in metres from the centre with the height as Z). Copy share link opens the same place and settings for anyone. Download PDF report saves a report with the maplity.com letterhead, the figures, the drawing and the tables.
How to Read Contour Lines
Spacing Shows the Slope
The closer the lines, the steeper the ground. With a 10 m interval, lines 10 m apart on the ground mean a slope of 100% (45°), and lines 100 m apart mean 10%. Evenly spaced lines mean an even slope; lines that get closer towards the top mean a slope that steepens (a convex hill), and lines that get closer towards the bottom mean a slope that eases off (a concave hill).
Shapes Show the Landforms
Where contour lines bend into a V or a U, the point of the V shows the direction of the landform. In a valley or a stream bed the V points uphill; on a ridge or a spur it points downhill. Small closed loops mark hilltops, or hollows when the heights go down towards the middle. A saddle, the low point on a ridge between two tops, looks like two sets of loops facing each other.
Rules That Always Hold
Contour lines never cross or split, because one place cannot have two heights. They only touch where there is a vertical cliff. Every line closes on itself somewhere, even if that is outside the map. Water flows at right angles to the lines, from higher to lower ones.
Choosing a Contour Interval
A good contour map has 10 to 30 lines across the area. Fewer lines hide the shape of the land; more lines crowd together on steep slopes. The Auto button follows one simple rule: it divides the relief (the highest point minus the lowest, as shown) by 22 and rounds up to the next common interval. The tables below are made from that rule, so they match what the tool and the 200-place tables show.
| Relief within the square | Auto interval | Number of levels | Terrain type |
|---|---|---|---|
| up to 22 m | 1 m | 0 to 22 | Flat, Gently rolling |
| 23 to 44 m | 2 m | 12 to 22 | Gently rolling |
| 45 to 110 m | 5 m | 9 to 22 | Gently rolling, Hilly |
| 111 to 220 m | 10 m | 12 to 22 | Hilly, Steep hills |
| 221 to 440 m | 20 m | 12 to 22 | Steep hills, Mountainous |
| 441 to 550 m | 25 m | 18 to 22 | Mountainous |
| 551 to 1,100 m | 50 m | 12 to 22 | Mountainous |
| over 1,100 m | 100 m | 11 or more | Mountainous |
| Relief within the square | Auto interval |
|---|---|
| up to 44 ft | 2 ft |
| 45 to 110 ft | 5 ft |
| 111 to 220 ft | 10 ft |
| 221 to 440 ft | 20 ft |
| 441 to 550 ft | 25 ft |
| 551 to 880 ft | 40 ft |
| 881 to 1,100 ft | 50 ft |
| 1,101 to 2,200 ft | 100 ft |
| over 2,200 ft | 200 ft |
Terrain types use the relief in metres: flat under 10 m, gently rolling 10 to 49 m, hilly 50 to 149 m, steep hills 150 to 399 m and mountainous from 400 m. You can always type your own interval: 0.5 m (or 1 ft) for drainage on flat ground where the data is detailed, for example in parts of the USA, or a round 10 m or 20 m to match a printed map.
10 Use Cases of a Contour Map Generator
Contour maps help anyone who needs to know the shape of the ground. These are the most common uses.
1. Site plans and building design
Architects and home builders need the shape of a plot before they place a house, a driveway or a retaining wall. A contour map with a 0.5 or 1 m interval shows which way the land falls and how much, and the DXF file drops straight into a CAD drawing as a first base layer.
2. Landscaping and garden design
Terraces, paths, ponds and lawns all depend on the fall of the land. Contour lines show where water will run, where a level area would need the most digging, and where a path can follow the slope gently.
3. Farming, drainage and keyline design
Farmers use contours to plan drainage, terraces and contour ploughing, which follows the lines to slow water and keep soil in place. Keyline and permaculture designs start from a good contour map of the land.
4. Hiking, orienteering and outdoor planning
Walkers and orienteers read contour lines to find valleys, ridges, cliffs and the easiest way up a hill. A contour map of a camp site, a climb or a crossing adds detail that small-scale maps leave out.
5. Roads, paths and earthworks
At the early stage of a project, engineers look at contour maps to set the line of a road or a path, estimate cut and fill, and find where slopes are too steep. The steepest slope and the relief figures give a quick first check.
6. Flood and water studies
Contour lines show the low ground where water gathers and the direction it flows. A map around a house, a river bend or a low field helps to see which areas sit only a metre or two above the water.
7. Solar farms and wind sites
Ground-mounted solar panels are cheapest on gentle, south-facing slopes, and wind turbines like exposed high ground. A contour map with the slope figures helps to screen a site before a detailed survey.
8. Geography teaching and learning
Contour maps are a core skill in geography and geology. Students can make a map of a volcano, a glacial valley or their own town, and learn to see hills, valleys, saddles and cliffs in the pattern of the lines.
9. Real estate and land buying
Two plots of the same size can be very different to build on. A contour map shows whether land is flat, gently sloping or steep, which affects the cost of foundations, access and drainage.
10. Maps, games and art
Designers use real contour lines for posters, laser-cut models, 3D printing, game levels and wall art. The clean SVG-style drawing in the PDF and the GeoJSON lines are easy to style in other programs.
The 10 Most Useful Things to Check on a Contour Map
These quick checks answer most questions about a piece of land.
- See which way the land falls. Water and slopes run at right angles to the contour lines, from higher lines to lower ones.
- Find the flattest spot for a house, a tent or a shed. Look for the widest gap between two lines inside your area.
- Find the steepest ground. Look where the lines crowd together; the Steepest slope card gives its grade.
- Check the height difference across a plot. The Relief card gives the difference between the highest and the lowest point in the square.
- Pick a sensible interval for a drawing. Press Auto first, then step to a round interval that suits the scale of your drawing.
- Spot valleys and ridges. Lines that form a V pointing uphill mark a valley; lines that form a V or U pointing downhill mark a ridge.
- Find hilltops and hollows. Small closed loops mark a top or a hollow; the labels on the index lines tell you which.
- Take the lines into CAD or GIS. Download DXF for CAD, or GeoJSON for QGIS and web maps, with the height stored on every line.
- See how much of the area is high or low. The chart of the area at each height shows whether most of the land is on the lower slopes or near the top.
- Keep a record of the ground. The PDF holds the drawing, the figures, the levels table and a link that opens the same map again.
The Mathematics Behind the Contour Lines
1. Finding the Tiles: Web Mercator
The terrain tiles use the Web Mercator grid of web maps. At zoom z the world is 256 × 2^z pixels wide, and a latitude and longitude become a pixel position with:
y = (1/2 - ln((1 + sin φ) / (1 - sin φ)) / (4π)) × 256 × 2^z
ground size of one pixel = 40,075,017 m × cos φ / (256 × 2^z)
At zoom 15 one pixel is about 4.8 m at the equator, 3.4 m at 45° and 2.4 m at 60°. The tool loads every tile that touches the square, usually 4 to 16, and joins them into one grid.
2. Turning Colours Into Heights
The Terrarium format stores each height in the red, green and blue of a pixel, with a resolution of 1/256 m:
Heights below -500 m (lower than any dry land on Earth) or above 9,000 m are treated as missing. A few tiles have thin seams of wrong values along their edges: a pixel more than 120 m from the median of its eight neighbours is removed, and small gaps are filled with the average of their neighbours. Real cliffs survive this test, because half of their neighbours are on the same side. Wider seams and narrow trenches a few pixels across are caught by a second test: a pixel that lies below (or above) the pixels 2 to 6 places away on both sides, by more than a 200% slope over that distance, is removed too, with the pixels right next to it. A real cliff is a step, high on one side and low on the other, so it passes. Where a zoom-15 tile is empty, the tool uses the matching part of the tile one level up.
3. Smoothing
Light smoothing replaces each height by the average of the 3 × 3 pixels around it; strong smoothing uses two passes of a 5 × 5 average. Missing pixels are skipped. Pixels outside the square are then removed, so the lines stop at its edge.
4. Tracing the Lines: Marching Squares
For every square of four neighbouring pixels and every contour level h, the tool marks each corner as above or below h. That gives 16 possible cases, and each case says which edges of the square the line crosses. The exact crossing point on an edge between heights a and b is found by linear interpolation:
levels: h = ceil(min / interval) × interval, then every interval up to the maximum
Two cases are saddles, where opposite corners are high. The tool looks at the average of the four corners to decide which way the line runs, so lines never cross. Each crossing point is named after its edge, so the pieces from neighbouring squares join exactly into long lines. Finally the Douglas-Peucker method removes points that lie within 0.35 pixel of a straight line, which keeps the files small without changing the shape.
5. Slope, Relief and the Height Chart
The slope at each pixel comes from the height differences to its left, right, upper and lower neighbours (central differences):
slope (%) = √((dz/dx)² + (dz/dy)²) × 100 angle = atan(slope / 100)
The relief is the highest height minus the lowest in the square. The mean elevation and the mean slope are averages over all pixels in the square. The steepest slope shown is the 99.5th percentile: only 0.5% of the area is steeper, so a single wrong pixel cannot set the figure. The height chart counts the pixels between each pair of contour levels (grouped when there are many) and divides by the total.
Data Sources and Libraries Used in This Tool
Elevation Data: AWS Terrain Tiles
The heights come from AWS Terrain Tiles, a free public dataset in the Registry of Open Data on AWS, first built by Mapzen. It merges many elevation models into one worldwide set of tiles: SRTM (NASA) for most land between 60° N and 56° S, USGS 3DEP (formerly the National Elevation Dataset) in the United States, EU-DEM in Europe, ArcticDEM in the far north, national models from several countries, and global models such as GMTED and ETOPO1 to fill gaps and the sea floor. The tool reads the Terrarium PNG version at zoom 15. The real detail depends on the source for each place, from about 10 m or better in much of the USA to about 30 m in many other places.
Maps and Search
The Terrain and Satellite maps are Esri World Topo Map and Esri World Imagery. The Street map is Maplity’s own vector basemap, built from OpenStreetMap data with Protomaps tiles hosted by KONAKTIVE, with CARTO and OpenStreetMap maps as fallbacks. The Terrain map opens first, at up to zoom 19, and if the Esri maps do not load, the tool switches to the Street map by itself. Place search uses Nominatim, the OpenStreetMap geocoder.
Software Libraries
The map, the contour lines and the labels are drawn with Leaflet 1.9, using its canvas renderer so that hundreds of lines stay fast. The PDF is built in your browser by jsPDF. The page runs on Next.js and React. The terrain decoding, the cleaning, the smoothing, the marching squares, the line joining and simplification, the drawing and the GeoJSON, KML and DXF writers are Maplity’s own code, with no contour library.
Limits of the Data
Terrain models measure the ground with a grid, so anything smaller than a few cells, such as a bank, a ditch, a wall or a single building, does not show. Where the dataset joins two sources, or fills a gap in one, the lines can show a straight edge or a blocky patch; the crater of Vesuvius has one. Some sources include buildings and trees (SRTM is a surface model), which can add bumps in towns and forests. Over the sea, lakes and wide rivers, the tiles hold water depths or the water surface, so the lowest point near a coast can be under water. For construction, boundaries and flood design, use a land survey or national lidar data.
Terrain in a 1 km² Square Around 200 Famous Places in Europe and the USA
How These Figures Were Made
The tables show the ground in a 1 km² square (1 × 1 km) around the same 200 famous places that are described on our Elevation Profile Viewer page. Each row was computed with this tool’s own engine: the default 1 km² square, light smoothing and the automatic interval. Relief is the difference between the highest and the lowest point in the square, Over 30% is the share of the area steeper than 30%, and Interval is the contour interval Auto would choose. Near coasts and lakes the lowest point can be under water, because the tiles include depths. In every row the relief is the highest minus the lowest height as printed, and the terrain type and the interval follow from that relief.
These heights can differ from the readings on the Elevation Profile Viewer page, because the two tools use different data. That page uses SRTM, which measures the top of buildings and trees. This tool uses AWS Terrain Tiles, which in the USA come from USGS 3DEP, a bare-ground model. So city landmarks read lower here: the Empire State Building site reads 43 m in SRTM but 8 to 24 m of ground in the 1 km² square here, and the Vehicle Assembly Building at Kennedy Space Center 83 m against -1 to 14 m.
Among the 200 places, 33 are mountainous in the 1 km² square, 41 have steep hills, 44 are hilly, 68 are gently rolling and 14 are flat. The largest relief is around Matterhorn summit (1,056 m) and the smallest around Shark Valley, Everglades National Park (3 m). The steepest ground on average is around Grand Teton summit, Half Dome summit, Yosemite and Matterhorn summit.
Terrain in a 1 km² Square Around 100 Famous Places in Europe
| # | Place | City, country | Lowest | Highest | Relief | Mean slope | Over 30% | Terrain | Interval |
|---|---|---|---|---|---|---|---|---|---|
| 1 | Big Ben (Elizabeth Tower) | London, United Kingdom | -3 m | 8 m | 11 m | 4.5% | 2% | Gently rolling | 1 m |
| 2 | Tower of London | London, United Kingdom | -3 m | 18 m | 21 m | 6.1% | 3% | Gently rolling | 1 m |
| 3 | Buckingham Palace | London, United Kingdom | 1 m | 18 m | 17 m | 4.0% | 1% | Gently rolling | 1 m |
| 4 | Stonehenge | Amesbury, United Kingdom | 80 m | 108 m | 28 m | 4.0% | 0% | Gently rolling | 2 m |
| 5 | Edinburgh Castle | Edinburgh, United Kingdom | 55 m | 101 m | 46 m | 8.9% | 1% | Gently rolling | 5 m |
| 6 | Ben Nevis summit | Fort William, United Kingdom | 824 m | 1,332 m | 508 m | 77.9% | 89% | Mountainous | 25 m |
| 7 | Snowdon (Yr Wyddfa) summit | Llanberis, United Kingdom | 604 m | 1,045 m | 441 m | 66.9% | 94% | Mountainous | 25 m |
| 8 | Roman Baths | Bath, United Kingdom | 15 m | 48 m | 33 m | 7.2% | 3% | Gently rolling | 2 m |
| 9 | Giant's Causeway | Bushmills, United Kingdom | 0 m | 83 m | 83 m | 17.8% | 19% | Hilly | 5 m |
| 10 | Trinity College Dublin | Dublin, Ireland | 1 m | 23 m | 22 m | 3.7% | 0% | Gently rolling | 1 m |
| 11 | Rock of Cashel | Cashel, Ireland | 84 m | 146 m | 62 m | 6.4% | 0% | Hilly | 5 m |
| 12 | Carrauntoohil summit | Killarney, Ireland | 522 m | 1,001 m | 479 m | 67.8% | 89% | Mountainous | 25 m |
| 13 | Eiffel Tower | Paris, France | 25 m | 69 m | 44 m | 7.5% | 3% | Gently rolling | 2 m |
| 14 | Louvre Museum | Paris, France | 24 m | 57 m | 33 m | 8.9% | 7% | Gently rolling | 2 m |
| 15 | Notre-Dame de Paris | Paris, France | 25 m | 60 m | 35 m | 11.4% | 11% | Gently rolling | 2 m |
| 16 | Sacré-Cœur Basilica, Montmartre | Paris, France | 65 m | 132 m | 67 m | 9.9% | 0% | Hilly | 5 m |
| 17 | Palace of Versailles | Versailles, France | 113 m | 153 m | 40 m | 5.8% | 0% | Gently rolling | 2 m |
| 18 | Mont-Saint-Michel Abbey | Le Mont-Saint-Michel, France | -9 m | 52 m | 61 m | 3.5% | 3% | Hilly | 5 m |
| 19 | Mont Blanc summit | Chamonix, France | 4,182 m | 4,790 m | 608 m | 77.4% | 91% | Mountainous | 50 m |
| 20 | Aiguille du Midi | Chamonix, France | 2,902 m | 3,719 m | 817 m | 82.4% | 79% | Mountainous | 50 m |
| 21 | Pont du Gard | Vers-Pont-du-Gard, France | 15 m | 102 m | 87 m | 14.5% | 9% | Hilly | 5 m |
| 22 | Cité de Carcassonne | Carcassonne, France | 100 m | 158 m | 58 m | 7.4% | 0% | Hilly | 5 m |
| 23 | Palais des Papes | Avignon, France | 13 m | 50 m | 37 m | 5.1% | 2% | Gently rolling | 2 m |
| 24 | Puy de Dôme summit | Clermont-Ferrand, France | 1,053 m | 1,438 m | 385 m | 52.0% | 79% | Steep hills | 20 m |
| 25 | Sagrada Família | Barcelona, Spain | 29 m | 76 m | 47 m | 4.8% | 0% | Gently rolling | 5 m |
| 26 | Alhambra | Granada, Spain | 690 m | 844 m | 154 m | 19.7% | 20% | Steep hills | 10 m |
| 27 | Royal Palace of Madrid | Madrid, Spain | 590 m | 679 m | 89 m | 10.0% | 1% | Hilly | 5 m |
| 28 | Seville Cathedral and Giralda | Seville, Spain | -1 m | 25 m | 26 m | 3.7% | 0% | Gently rolling | 2 m |
| 29 | Mosque-Cathedral of Córdoba | Córdoba, Spain | 85 m | 132 m | 47 m | 6.7% | 2% | Gently rolling | 5 m |
| 30 | Guggenheim Museum Bilbao | Bilbao, Spain | -1 m | 122 m | 123 m | 15.1% | 13% | Hilly | 10 m |
| 31 | Santiago de Compostela Cathedral | Santiago de Compostela, Spain | 225 m | 300 m | 75 m | 9.5% | 0% | Hilly | 5 m |
| 32 | Mount Teide summit | Tenerife, Spain | 3,301 m | 3,681 m | 380 m | 45.2% | 79% | Steep hills | 20 m |
| 33 | Montserrat Monastery | Monistrol de Montserrat, Spain | 392 m | 1,040 m | 648 m | 70.2% | 93% | Mountainous | 50 m |
| 34 | Belém Tower | Lisbon, Portugal | -1 m | 22 m | 23 m | 2.2% | 0% | Gently rolling | 2 m |
| 35 | São Jorge Castle | Lisbon, Portugal | 6 m | 96 m | 90 m | 14.5% | 3% | Hilly | 5 m |
| 36 | Porto Cathedral (Sé do Porto) | Porto, Portugal | -4 m | 102 m | 106 m | 15.8% | 14% | Hilly | 5 m |
| 37 | Pena Palace | Sintra, Portugal | 311 m | 491 m | 180 m | 23.4% | 28% | Steep hills | 10 m |
| 38 | Colosseum | Rome, Italy | 18 m | 59 m | 41 m | 7.3% | 0% | Gently rolling | 2 m |
| 39 | Trevi Fountain | Rome, Italy | 26 m | 68 m | 42 m | 5.3% | 0% | Gently rolling | 2 m |
| 40 | Leaning Tower of Pisa | Pisa, Italy | 1 m | 12 m | 11 m | 2.0% | 0% | Gently rolling | 1 m |
| 41 | Florence Cathedral (Duomo) | Florence, Italy | 45 m | 76 m | 31 m | 4.5% | 1% | Gently rolling | 2 m |
| 42 | Piazzale Michelangelo | Florence, Italy | 45 m | 138 m | 93 m | 12.3% | 0% | Hilly | 5 m |
| 43 | St Mark's Square | Venice, Italy | -2 m | 13 m | 15 m | 3.6% | 0% | Gently rolling | 1 m |
| 44 | Milan Cathedral (Duomo di Milano) | Milan, Italy | 119 m | 155 m | 36 m | 4.9% | 1% | Gently rolling | 2 m |
| 45 | Pompeii Forum | Pompei, Italy | 8 m | 47 m | 39 m | 4.4% | 0% | Gently rolling | 2 m |
| 46 | Mount Vesuvius crater rim | Naples, Italy | 895 m | 1,273 m | 378 m | 71.9% | 88% | Steep hills | 20 m |
| 47 | Mount Etna summit area | Catania, Italy | 3,056 m | 3,320 m | 264 m | 39.2% | 67% | Steep hills | 20 m |
| 48 | Tre Cime di Lavaredo | Auronzo di Cadore, Italy | 2,263 m | 2,820 m | 557 m | 85.1% | 88% | Mountainous | 50 m |
| 49 | St Peter's Basilica | Vatican City, Vatican City | 23 m | 78 m | 55 m | 9.8% | 1% | Hilly | 5 m |
| 50 | Brandenburg Gate | Berlin, Germany | 27 m | 46 m | 19 m | 4.1% | 0% | Gently rolling | 1 m |
| 51 | Cologne Cathedral | Cologne, Germany | 37 m | 64 m | 27 m | 3.7% | 1% | Gently rolling | 2 m |
| 52 | Neuschwanstein Castle | Schwangau, Germany | 805 m | 1,209 m | 404 m | 39.6% | 62% | Mountainous | 20 m |
| 53 | Marienplatz | Munich, Germany | 515 m | 530 m | 15 m | 3.6% | 0% | Gently rolling | 1 m |
| 54 | Zugspitze summit | Garmisch-Partenkirchen, Germany | 2,245 m | 2,955 m | 710 m | 130.0% | 99% | Mountainous | 50 m |
| 55 | Heidelberg Castle | Heidelberg, Germany | 103 m | 415 m | 312 m | 29.2% | 52% | Steep hills | 20 m |
| 56 | Frauenkirche | Dresden, Germany | 104 m | 127 m | 23 m | 4.1% | 0% | Gently rolling | 2 m |
| 57 | Elbphilharmonie | Hamburg, Germany | -1 m | 13 m | 14 m | 3.3% | 0% | Gently rolling | 1 m |
| 58 | Brocken summit | Schierke (Harz), Germany | 1,012 m | 1,141 m | 129 m | 18.1% | 0% | Hilly | 10 m |
| 59 | Matterhorn summit | Zermatt, Switzerland | 3,298 m | 4,354 m | 1,056 m | 130.2% | 100% | Mountainous | 50 m |
| 60 | Jungfraujoch | Grindelwald / Wengen, Switzerland | 2,946 m | 3,581 m | 635 m | 50.4% | 56% | Mountainous | 50 m |
| 61 | Chapel Bridge (Kapellbrücke) | Lucerne, Switzerland | 427 m | 487 m | 60 m | 7.9% | 3% | Hilly | 5 m |
| 62 | Pilatus Kulm | Lucerne, Switzerland | 1,478 m | 2,075 m | 597 m | 79.9% | 91% | Mountainous | 50 m |
| 63 | Château de Chillon | Veytaux (Montreux), Switzerland | 367 m | 685 m | 318 m | 25.7% | 40% | Steep hills | 20 m |
| 64 | Schönbrunn Palace | Vienna, Austria | 179 m | 232 m | 53 m | 5.5% | 5% | Hilly | 5 m |
| 65 | St Stephen's Cathedral | Vienna, Austria | 156 m | 185 m | 29 m | 3.9% | 2% | Gently rolling | 2 m |
| 66 | Hohensalzburg Fortress | Salzburg, Austria | 415 m | 544 m | 129 m | 19.3% | 21% | Hilly | 10 m |
| 67 | Hallstatt market square | Hallstatt, Austria | 508 m | 1,009 m | 501 m | 43.7% | 45% | Mountainous | 25 m |
| 68 | Grossglockner summit | Heiligenblut, Austria | 3,022 m | 3,793 m | 771 m | 117.4% | 96% | Mountainous | 50 m |
| 69 | Rijksmuseum | Amsterdam, Netherlands | 3 m | 11 m | 8 m | 1.9% | 0% | Flat | 1 m |
| 70 | Kinderdijk windmills | Kinderdijk, Netherlands | -3 m | 3 m | 6 m | 1.1% | 0% | Flat | 1 m |
| 71 | Vaalserberg (Three-Country Point) | Vaals, Netherlands | 252 m | 332 m | 80 m | 11.0% | 0% | Hilly | 5 m |
| 72 | Grand-Place | Brussels, Belgium | 21 m | 66 m | 45 m | 4.1% | 0% | Gently rolling | 5 m |
| 73 | Atomium | Brussels, Belgium | 34 m | 74 m | 40 m | 4.7% | 0% | Gently rolling | 2 m |
| 74 | Belfry of Bruges | Bruges, Belgium | 5 m | 13 m | 8 m | 1.8% | 0% | Flat | 1 m |
| 75 | Acropolis of Athens (Parthenon) | Athens, Greece | 61 m | 149 m | 88 m | 11.9% | 8% | Hilly | 5 m |
| 76 | Mount Olympus (Mytikas) | Litochoro, Greece | 2,303 m | 2,840 m | 537 m | 80.3% | 92% | Mountainous | 25 m |
| 77 | Meteora (Great Meteoron Monastery) | Kalambaka, Greece | 276 m | 552 m | 276 m | 39.2% | 59% | Steep hills | 20 m |
| 78 | Oia village | Santorini, Greece | -10 m | 139 m | 149 m | 22.8% | 24% | Hilly | 10 m |
| 79 | Temple of Apollo, Delphi | Delphi, Greece | 394 m | 974 m | 580 m | 53.6% | 83% | Mountainous | 50 m |
| 80 | Prague Castle | Prague, Czechia | 196 m | 274 m | 78 m | 10.4% | 3% | Hilly | 5 m |
| 81 | Český Krumlov Castle | Český Krumlov, Czechia | 480 m | 550 m | 70 m | 10.9% | 2% | Hilly | 5 m |
| 82 | Wawel Royal Castle | Kraków, Poland | 198 m | 231 m | 33 m | 4.5% | 1% | Gently rolling | 2 m |
| 83 | Old Town Market Place | Warsaw, Poland | 73 m | 112 m | 39 m | 4.8% | 0% | Gently rolling | 2 m |
| 84 | Kasprowy Wierch | Zakopane, Poland | 1,629 m | 1,974 m | 345 m | 53.7% | 86% | Steep hills | 20 m |
| 85 | Hungarian Parliament Building | Budapest, Hungary | 92 m | 126 m | 34 m | 7.2% | 5% | Gently rolling | 2 m |
| 86 | Fisherman's Bastion | Budapest, Hungary | 94 m | 174 m | 80 m | 13.1% | 4% | Hilly | 5 m |
| 87 | Nyhavn | Copenhagen, Denmark | 0 m | 15 m | 15 m | 3.5% | 1% | Gently rolling | 1 m |
| 88 | Stockholm Royal Palace | Stockholm, Sweden | 3 m | 36 m | 33 m | 10.2% | 5% | Gently rolling | 2 m |
| 89 | Preikestolen (Pulpit Rock) | Stavanger region, Norway | 0 m | 701 m | 701 m | 92.9% | 69% | Mountainous | 50 m |
| 90 | Dubrovnik Old Town (Stradun) | Dubrovnik, Croatia | -2 m | 210 m | 212 m | 16.7% | 23% | Steep hills | 10 m |
| 91 | Plitvice Lakes (Veliki Slap) | Plitvička Jezera, Croatia | 487 m | 628 m | 141 m | 18.5% | 21% | Hilly | 10 m |
| 92 | Bled Castle | Bled, Slovenia | 469 m | 573 m | 104 m | 13.1% | 11% | Hilly | 5 m |
| 93 | Hagia Sophia | Istanbul, Türkiye | 0 m | 58 m | 58 m | 8.6% | 0% | Hilly | 5 m |
| 94 | Casino de Monte-Carlo | Monte Carlo, Monaco | -4 m | 184 m | 188 m | 13.9% | 13% | Steep hills | 10 m |
| 95 | St John's Co-Cathedral | Valletta, Malta | -8 m | 66 m | 74 m | 13.7% | 6% | Hilly | 5 m |
| 96 | Bran Castle | Bran, Romania | 741 m | 944 m | 203 m | 26.3% | 36% | Steep hills | 10 m |
| 97 | Rila Monastery | Rila, Bulgaria | 1,098 m | 1,567 m | 469 m | 48.2% | 81% | Mountainous | 25 m |
| 98 | Kotor Old Town | Kotor, Montenegro | -2 m | 296 m | 298 m | 26.6% | 36% | Steep hills | 20 m |
| 99 | Vaduz Castle | Vaduz, Liechtenstein | 453 m | 861 m | 408 m | 37.2% | 57% | Mountainous | 20 m |
| 100 | Guaita Tower | City of San Marino, San Marino | 418 m | 710 m | 292 m | 39.5% | 60% | Steep hills | 20 m |
Terrain in a 1 km² Square Around 100 Famous Places in the USA
| # | Place | City, country | Lowest | Highest | Relief | Mean slope | Over 30% | Terrain | Interval |
|---|---|---|---|---|---|---|---|---|---|
| 1 | Statue of Liberty | New York, NY, United States | -1 m | 6 m | 7 m | 0.6% | 0% | Flat | 1 m |
| 2 | Empire State Building | New York, NY, United States | 8 m | 24 m | 16 m | 1.5% | 0% | Gently rolling | 1 m |
| 3 | Belvedere Castle, Central Park | New York, NY, United States | 15 m | 43 m | 28 m | 5.5% | 1% | Gently rolling | 2 m |
| 4 | One World Trade Center | New York, NY, United States | -8 m | 22 m | 30 m | 6.0% | 3% | Gently rolling | 2 m |
| 5 | Niagara Falls (Terrapin Point) | Niagara Falls, NY, United States | 70 m | 191 m | 121 m | 29.2% | 31% | Hilly | 10 m |
| 6 | Mount Marcy summit | Keene, NY, United States | 1,314 m | 1,627 m | 313 m | 46.5% | 87% | Steep hills | 20 m |
| 7 | United States Capitol | Washington, DC, United States | -3 m | 30 m | 33 m | 5.3% | 1% | Gently rolling | 2 m |
| 8 | Lincoln Memorial | Washington, DC, United States | -6 m | 23 m | 29 m | 4.3% | 1% | Gently rolling | 2 m |
| 9 | The White House | Washington, DC, United States | 2 m | 23 m | 21 m | 3.5% | 0% | Gently rolling | 1 m |
| 10 | Arlington National Cemetery | Arlington, VA, United States | 7 m | 65 m | 58 m | 8.2% | 2% | Hilly | 5 m |
| 11 | Mount Vernon | Mount Vernon, VA, United States | 6 m | 23 m | 17 m | 4.4% | 0% | Gently rolling | 1 m |
| 12 | Fort McHenry | Baltimore, MD, United States | 0 m | 12 m | 12 m | 2.2% | 1% | Gently rolling | 1 m |
| 13 | Independence Hall | Philadelphia, PA, United States | 1 m | 14 m | 13 m | 3.2% | 0% | Gently rolling | 1 m |
| 14 | Little Round Top, Gettysburg | Gettysburg, PA, United States | 149 m | 217 m | 68 m | 10.6% | 2% | Hilly | 5 m |
| 15 | Fallingwater | Mill Run, PA, United States | 335 m | 517 m | 182 m | 22.0% | 21% | Steep hills | 10 m |
| 16 | Boston Common | Boston, MA, United States | 2 m | 30 m | 28 m | 3.5% | 0% | Gently rolling | 2 m |
| 17 | Fenway Park | Boston, MA, United States | 0 m | 9 m | 9 m | 1.4% | 0% | Flat | 1 m |
| 18 | Cadillac Mountain summit | Bar Harbor, ME, United States | 245 m | 466 m | 221 m | 30.6% | 41% | Steep hills | 20 m |
| 19 | Mount Washington summit | Sargent’s Purchase, NH, United States | 1,604 m | 1,916 m | 312 m | 37.8% | 62% | Steep hills | 20 m |
| 20 | Mount Mitchell summit | Burnsville, NC, United States | 1,755 m | 2,037 m | 282 m | 43.5% | 87% | Steep hills | 20 m |
| 21 | Biltmore Estate | Asheville, NC, United States | 610 m | 725 m | 115 m | 21.2% | 21% | Hilly | 10 m |
| 22 | Wright Brothers National Memorial | Kill Devil Hills, NC, United States | 2 m | 28 m | 26 m | 2.9% | 1% | Gently rolling | 2 m |
| 23 | Clingmans Dome | Great Smoky Mountains, TN, United States | 1,646 m | 2,026 m | 380 m | 51.1% | 85% | Steep hills | 20 m |
| 24 | Graceland | Memphis, TN, United States | 72 m | 89 m | 17 m | 5.6% | 0% | Gently rolling | 1 m |
| 25 | The Parthenon, Centennial Park | Nashville, TN, United States | 146 m | 195 m | 49 m | 4.9% | 0% | Gently rolling | 5 m |
| 26 | Stone Mountain summit | Stone Mountain, GA, United States | 265 m | 513 m | 248 m | 44.4% | 66% | Steep hills | 20 m |
| 27 | Centennial Olympic Park | Atlanta, GA, United States | 286 m | 329 m | 43 m | 6.1% | 1% | Gently rolling | 2 m |
| 28 | Forsyth Park | Savannah, GA, United States | 10 m | 33 m | 23 m | 3.2% | 1% | Gently rolling | 2 m |
| 29 | Vehicle Assembly Building, Kennedy Space Center | Merritt Island, FL, United States | -1 m | 14 m | 15 m | 2.1% | 0% | Gently rolling | 1 m |
| 30 | Cinderella Castle, Magic Kingdom | Bay Lake, FL, United States | 28 m | 31 m | 3 m | 0.3% | 0% | Flat | 1 m |
| 31 | Shark Valley, Everglades National Park | Miami-Dade County, FL, United States | 1 m | 4 m | 3 m | 0.3% | 0% | Flat | 1 m |
| 32 | South Beach (Ocean Drive) | Miami Beach, FL, United States | 0 m | 4 m | 4 m | 1.3% | 0% | Flat | 1 m |
| 33 | Southernmost Point Buoy | Key West, FL, United States | -7 m | 15 m | 22 m | 2.1% | 1% | Gently rolling | 1 m |
| 34 | Castillo de San Marcos | St. Augustine, FL, United States | 0 m | 4 m | 4 m | 1.2% | 0% | Flat | 1 m |
| 35 | U.S. Space & Rocket Center | Huntsville, AL, United States | 193 m | 258 m | 65 m | 6.4% | 0% | Hilly | 5 m |
| 36 | Jackson Square, French Quarter | New Orleans, LA, United States | 1 m | 7 m | 6 m | 1.5% | 0% | Flat | 1 m |
| 37 | Bathhouse Row, Hot Springs | Hot Springs, AR, United States | 180 m | 303 m | 123 m | 22.9% | 34% | Hilly | 10 m |
| 38 | Churchill Downs | Louisville, KY, United States | 136 m | 144 m | 8 m | 2.3% | 0% | Flat | 1 m |
| 39 | Mammoth Cave Visitor Center | Mammoth Cave, KY, United States | 139 m | 238 m | 99 m | 18.9% | 23% | Hilly | 5 m |
| 40 | Rock and Roll Hall of Fame | Cleveland, OH, United States | 173 m | 199 m | 26 m | 5.4% | 3% | Gently rolling | 2 m |
| 41 | Renaissance Center | Detroit, MI, United States | 174 m | 185 m | 11 m | 3.2% | 1% | Gently rolling | 1 m |
| 42 | Indianapolis Motor Speedway | Speedway, IN, United States | 219 m | 226 m | 7 m | 3.0% | 0% | Flat | 1 m |
| 43 | Willis Tower | Chicago, IL, United States | 175 m | 183 m | 8 m | 2.0% | 0% | Flat | 1 m |
| 44 | Cloud Gate, Millennium Park | Chicago, IL, United States | 176 m | 185 m | 9 m | 1.9% | 0% | Flat | 1 m |
| 45 | Wisconsin State Capitol | Madison, WI, United States | 257 m | 283 m | 26 m | 6.7% | 2% | Gently rolling | 2 m |
| 46 | Minnehaha Falls | Minneapolis, MN, United States | 214 m | 257 m | 43 m | 9.3% | 8% | Gently rolling | 2 m |
| 47 | Gateway Arch | St. Louis, MO, United States | 116 m | 146 m | 30 m | 6.4% | 4% | Gently rolling | 2 m |
| 48 | Mount Rushmore | Keystone, SD, United States | 1,498 m | 1,744 m | 246 m | 48.0% | 62% | Steep hills | 20 m |
| 49 | Devils Tower | Crook County, WY, United States | 1,183 m | 1,562 m | 379 m | 35.5% | 41% | Steep hills | 20 m |
| 50 | Old Faithful, Yellowstone | Yellowstone National Park, WY, United States | 2,234 m | 2,336 m | 102 m | 5.6% | 3% | Hilly | 5 m |
| 51 | Grand Teton summit | Jackson, WY, United States | 3,202 m | 4,196 m | 994 m | 175.9% | 100% | Mountainous | 50 m |
| 52 | Chimney Rock | Bayard, NE, United States | 1,152 m | 1,281 m | 129 m | 14.1% | 9% | Hilly | 10 m |
| 53 | Colorado State Capitol | Denver, CO, United States | 1,591 m | 1,616 m | 25 m | 3.6% | 0% | Gently rolling | 2 m |
| 54 | Red Rocks Amphitheatre | Morrison, CO, United States | 1,826 m | 2,102 m | 276 m | 43.2% | 63% | Steep hills | 20 m |
| 55 | Pikes Peak summit | Colorado Springs, CO, United States | 3,850 m | 4,303 m | 453 m | 66.2% | 85% | Mountainous | 25 m |
| 56 | Mount Elbert summit | Leadville, CO, United States | 3,919 m | 4,397 m | 478 m | 55.9% | 94% | Mountainous | 25 m |
| 57 | Garden of the Gods | Colorado Springs, CO, United States | 1,914 m | 1,992 m | 78 m | 10.3% | 11% | Hilly | 5 m |
| 58 | Cliff Palace, Mesa Verde | Montezuma County, CO, United States | 1,949 m | 2,102 m | 153 m | 26.2% | 23% | Steep hills | 10 m |
| 59 | Delicate Arch, Arches National Park | Moab, UT, United States | 1,327 m | 1,495 m | 168 m | 37.0% | 35% | Steep hills | 10 m |
| 60 | Angels Landing, Zion National Park | Springdale, UT, United States | 1,304 m | 1,790 m | 486 m | 113.0% | 73% | Mountainous | 25 m |
| 61 | Sunset Point, Bryce Canyon | Bryce Canyon City, UT, United States | 2,266 m | 2,478 m | 212 m | 44.3% | 54% | Steep hills | 10 m |
| 62 | Temple Square | Salt Lake City, UT, United States | 1,304 m | 1,372 m | 68 m | 6.9% | 3% | Hilly | 5 m |
| 63 | Mather Point, Grand Canyon South Rim | Grand Canyon Village, AZ, United States | 1,256 m | 2,176 m | 920 m | 80.7% | 58% | Mountainous | 50 m |
| 64 | Horseshoe Bend overlook | Page, AZ, United States | 939 m | 1,332 m | 393 m | 48.9% | 29% | Steep hills | 20 m |
| 65 | Cathedral Rock | Sedona, AZ, United States | 1,210 m | 1,519 m | 309 m | 57.1% | 69% | Steep hills | 20 m |
| 66 | Monument Valley (The Mittens view) | Oljato-Monument Valley, AZ, United States | 1,610 m | 1,722 m | 112 m | 14.5% | 13% | Hilly | 10 m |
| 67 | Meteor Crater rim | Winslow, AZ, United States | 1,563 m | 1,750 m | 187 m | 39.5% | 55% | Steep hills | 10 m |
| 68 | Hoover Dam | Boulder City, NV, United States | 217 m | 511 m | 294 m | 45.3% | 52% | Steep hills | 20 m |
| 69 | Bellagio Fountains, Las Vegas Strip | Paradise, NV, United States | 641 m | 658 m | 17 m | 1.8% | 0% | Gently rolling | 1 m |
| 70 | Carlsbad Caverns Visitor Center | Carlsbad, NM, United States | 1,265 m | 1,360 m | 95 m | 16.4% | 14% | Hilly | 5 m |
| 71 | White Sands dune field | Alamogordo, NM, United States | 1,197 m | 1,207 m | 10 m | 0.8% | 0% | Gently rolling | 1 m |
| 72 | Santa Fe Plaza | Santa Fe, NM, United States | 2,122 m | 2,174 m | 52 m | 3.6% | 1% | Hilly | 5 m |
| 73 | Taos Pueblo | Taos, NM, United States | 2,158 m | 2,184 m | 26 m | 2.2% | 0% | Gently rolling | 2 m |
| 74 | The Alamo | San Antonio, TX, United States | 190 m | 209 m | 19 m | 3.6% | 1% | Gently rolling | 1 m |
| 75 | Texas State Capitol | Austin, TX, United States | 142 m | 171 m | 29 m | 4.9% | 0% | Gently rolling | 2 m |
| 76 | Space Center Houston | Houston, TX, United States | 0 m | 10 m | 10 m | 3.3% | 1% | Gently rolling | 1 m |
| 77 | Guadalupe Peak summit | Culberson County, TX, United States | 1,906 m | 2,669 m | 763 m | 86.7% | 98% | Mountainous | 50 m |
| 78 | Chisos Basin, Big Bend | Big Bend National Park, TX, United States | 1,546 m | 1,785 m | 239 m | 28.8% | 37% | Steep hills | 20 m |
| 79 | Badwater Basin, Death Valley | Inyo County, CA, United States | -84 m | 241 m | 325 m | 39.1% | 45% | Steep hills | 20 m |
| 80 | Mount Whitney summit | Lone Pine, CA, United States | 3,767 m | 4,414 m | 647 m | 103.3% | 87% | Mountainous | 50 m |
| 81 | Half Dome summit, Yosemite | Yosemite National Park, CA, United States | 1,710 m | 2,696 m | 986 m | 143.7% | 97% | Mountainous | 50 m |
| 82 | Tunnel View, Yosemite | Yosemite National Park, CA, United States | 1,162 m | 1,672 m | 510 m | 55.6% | 83% | Mountainous | 25 m |
| 83 | Golden Gate Bridge (south end) | San Francisco, CA, United States | -43 m | 82 m | 125 m | 16.5% | 15% | Hilly | 10 m |
| 84 | Alcatraz Island | San Francisco, CA, United States | -42 m | 42 m | 84 m | 13.3% | 9% | Hilly | 5 m |
| 85 | Hollywood Sign | Los Angeles, CA, United States | 278 m | 556 m | 278 m | 59.7% | 88% | Steep hills | 20 m |
| 86 | Santa Monica Pier | Santa Monica, CA, United States | -2 m | 22 m | 24 m | 3.5% | 1% | Gently rolling | 2 m |
| 87 | Balboa Park | San Diego, CA, United States | 40 m | 94 m | 54 m | 13.0% | 14% | Hilly | 5 m |
| 88 | Emerald Bay, Lake Tahoe | South Lake Tahoe, CA, United States | 1,897 m | 2,340 m | 443 m | 46.1% | 66% | Mountainous | 25 m |
| 89 | General Sherman Tree, Sequoia | Sequoia National Park, CA, United States | 1,963 m | 2,231 m | 268 m | 28.8% | 37% | Steep hills | 20 m |
| 90 | Rim Village, Crater Lake | Crater Lake National Park, OR, United States | 1,881 m | 2,358 m | 477 m | 57.6% | 63% | Mountainous | 25 m |
| 91 | Mount Hood summit | Government Camp, OR, United States | 2,745 m | 3,427 m | 682 m | 101.4% | 98% | Mountainous | 50 m |
| 92 | Multnomah Falls | Columbia River Gorge, OR, United States | 4 m | 543 m | 539 m | 70.5% | 72% | Mountainous | 25 m |
| 93 | Space Needle | Seattle, WA, United States | 4 m | 47 m | 43 m | 5.7% | 1% | Gently rolling | 2 m |
| 94 | Mount Rainier summit | Pierce County, WA, United States | 4,079 m | 4,392 m | 313 m | 42.4% | 75% | Steep hills | 20 m |
| 95 | Johnston Ridge, Mount St. Helens | Skamania County, WA, United States | 1,004 m | 1,315 m | 311 m | 52.2% | 70% | Steep hills | 20 m |
| 96 | Logan Pass, Glacier National Park | Glacier National Park, MT, United States | 1,861 m | 2,402 m | 541 m | 41.7% | 41% | Mountainous | 25 m |
| 97 | Mauna Kea summit | Hawaiʻi Island, HI, United States | 3,942 m | 4,200 m | 258 m | 39.8% | 75% | Steep hills | 20 m |
| 98 | Diamond Head crater (Lēʻahi) | Honolulu, HI, United States | 26 m | 196 m | 170 m | 19.2% | 28% | Steep hills | 10 m |
| 99 | Waikiki Beach | Honolulu, HI, United States | -6 m | 13 m | 19 m | 1.6% | 2% | Gently rolling | 1 m |
| 100 | Haleakalā summit | Maui, HI, United States | 2,885 m | 3,053 m | 168 m | 26.9% | 30% | Steep hills | 10 m |